我想为 venneuler 维恩图创建一个图例。这应该是直截了当的,因为函数 venneuler 返回用于控制台的颜色。颜色的值介于 0 和 1 之间。我想知道如何将存储在 $colors 中的数字值转换为可用于填充图例中的填充参数的值。
我在下面尝试使用从 venneuler 中提取的 $colors 和从 colors() 中索引。我知道这是不正确的,因为 colors() 是用间隔值索引的,但将其放入以显示我想要的内容。
set.seed(20)
x <- matrix(sample(0:1, 100, replace = TRUE), 10, 10)
colnames(x) <- LETTERS[1:10]
rownames(x) <- letters[1:10]
require(venneuler)
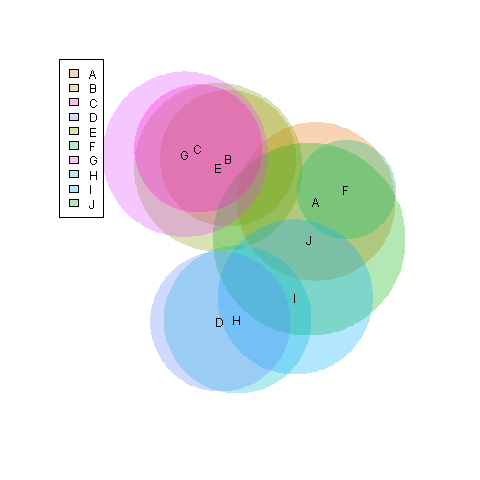
y <- venneuler(x)
plot(y)
y$colors
legend(.05, .9, legend = colnames(x), fill = colors()[y$colors])
最佳答案
通过阅读 plot.VennDiagram及其默认值,您可以看到它如何转换 y$colors 中的数字到 rgb 颜色字符串。 (尝试 getAnywhere("plot.VennDiagram") 自己看看。)
在这里,我收集了将颜色(在您的情况下)处理为单个函数的两位代码,该函数将为您进行转换。传说的定位可能会得到改善,但这是另一个问题......
col.fn <- function(col, alpha=0.3) {
    col<- hcl(col * 360, 130, 60)
    col <- col2rgb(col)/255
    col <- rgb(col[1, ], col[2, ], col[3, ], alpha)
    col
}

COL <- col.fn(y$colors)
# The original order of columns in x is jumbled in the object returned
# by venneuler. This code is needed to put the colors and labels back
# in the original order (here alphabetical).
LABS <- y$labels
id <-  match(colnames(x), LABS)

plot(y)
legend(.05, .9, legend = LABS[id], fill = COL[id], x="topleft")
关于r - venneuler 中的图例维恩图,我们在Stack Overflow上找到一个类似的问题: https://stackoverflow.com/questions/9121956/