我希望这个例子会很清楚。我想要堆叠条形,中间条形跨越“0”,因为它代表一个中性值。这与李克特量表一起使用。为了重现性,我使用了钻石数据集。
以下示例与我的用例非常接近,并说明了我将“好”或“正”数据按正确顺序排列的困难(因此中性最接近 0)。
这是我的代码:
require(tidyverse)

diamonds_new <- diamonds %>%
  mutate(quality = fct_recode(cut, "Very poor" = "Fair", "Poor" = "Good", "Neutral" = "Very Good", "Good" = "Premium", "Excellent" = "Ideal")) %>%
  select(color, clarity, quality) %>%
  group_by(color, clarity, quality) %>% count()

diamonds_bad <-
  diamonds_new %>% filter(quality %in% c("Very poor", "Poor", "Neutral")) %>%
  mutate(n = ifelse(quality == "Neutral", -n/2, -n))

diamonds_good <-
  diamonds_new %>% filter(quality %in% c("Neutral", "Good", "Excellent")) %>%
  mutate(n = ifelse(quality == "Neutral", n/2, n)) # %>%
#  arrange(color, clarity, desc(quality))  # this doesn't seem to make a difference

ggplot() + geom_col(data = diamonds_bad, aes(x=color, y = n, fill = quality)) +
  geom_col(data = diamonds_good, aes(x=color, y = n, fill = quality)) +
  facet_grid(. ~ clarity, scales = "free") +
  coord_flip()

我也试过使用
scale_fill_manual()但也没有找到可行的方法。我相信这比一些现有的例子更复杂,这些例子没有负值的复杂性或需要
span 0 .使用当前版本的 ggplot,我错过了什么?另外,我是否正确地认为需要拆分正负集,或者至少这样做更容易?
最佳答案
由 geom_col 创建的列使用 position_stack 形成它分别堆叠正值和负值,其中正值向上堆叠,负值向下堆叠。中心组,Neutral在此示例中,通过将其设置为其原始值的一半,然后将其绘制为正值和负值,使其跨度为 0。此外,对于正值,需要颠倒组的顺序。
这种方法将有助于展示我使用的一些调查的结果,因此我将它变成了一个函数,使其更通用。
library(tidyverse)
#
# summarize groups and save counts in variable quality_cnt
#
  diamonds_cnt <- diamonds %>%
    mutate(quality = fct_recode(cut, "Very_Poor" = "Fair", "Poor" = "Good",
                                "Neutral" = "Very Good", "Good" = "Premium", "Excellent" = "Ideal")) %>%
    select(color, clarity, quality) %>%
    group_by(color, clarity, quality) %>% summarize(quality_cnt = n())

# make function to plot counts

  plot_ratings <- function(survey, rated_item, rating_cnt, rating, rating_cat, facet = "wrap") {
#
#  Input:
#         rated_item  =  unquoted variable name of rated items
#         rating = unquoted variable name of ratings for each rated_items;
#                  variable should be a factor ordered from lowest to highest
#         rating_cnt = unquoted variable name of counts or frequencies for each rated_item
#         rated_cat = unquoted variable name of categories of rated items
#         facet  = "grid" for all panels on one row or
#                   "wrap" to spread panels across multiple rows
#
#  make arguments quosures
#
    rated_item <- enquo(rated_item)
    rating_cnt <- enquo(rating_cnt)
    rating <- enquo(rating)
    rating_cat <- enquo(rating_cat)
#
# If number of rating levels is odd, find middle rating
#
  rating_levels <- levels(pull(survey, !!rating))
  mid_level <-  ceiling(length(rating_levels)/2)
  mid_rating <- ifelse(length(rating_levels)%%2 == 1, rating_levels[mid_level], NA_character_)
#
# make local variabels for use with aes
# plot positive and negative columns separately
#
  survey <- survey %>% mutate( rating_plt = !!rating, rating_cnt_plt = !!rating_cnt)

  sp <- ggplot(survey, aes_(x = rated_item,  fill = rating)) +
        geom_col(data=filter(survey, !!rating %in% tail(rating_levels, mid_level)),
                 aes( y = ifelse(rating_plt == mid_rating, .5*rating_cnt_plt, rating_cnt_plt)),
                 position = position_stack(reverse = TRUE )) +
        geom_col(data=filter(survey, !!rating %in% head(rating_levels, mid_level)),
                 aes( y = ifelse(rating_plt == mid_rating, -.5*rating_cnt_plt, -rating_cnt_plt)),
                 position = "stack") +
        labs(y = rating_cnt) +
        scale_fill_brewer(palette = "RdYlGn", direction = -1) +
        coord_flip() +
        switch(facet,
               grid = facet_grid( facets=rating_cat, scales = "free_x"),
               wrap = facet_wrap( facets=rating_cat, scales = "free_x"))
  plot(sp)
  }
#
#  Use function to make charts
#
  plot_ratings(diamonds_cnt,  rated_item = color, rating_cnt = quality_cnt,
               rating = quality, rating_cat = clarity, facet = "wrap")
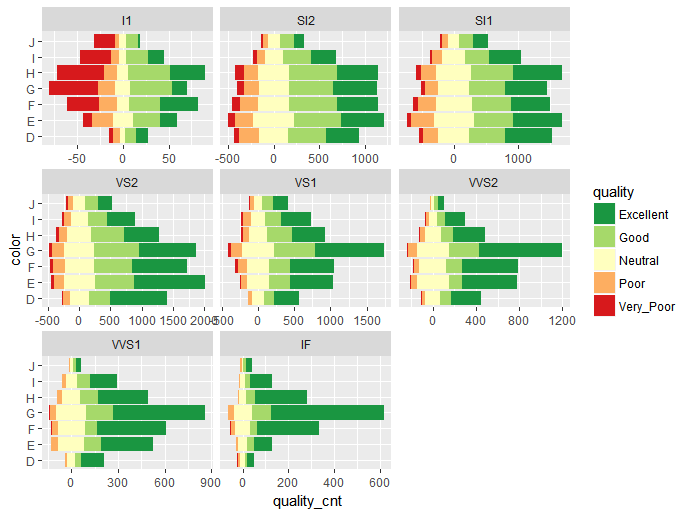
这给出了图表
关于r - 多面水平发散堆积条形图,包括使用 dplyr 和 ggplot 的负值,我们在Stack Overflow上找到一个类似的问题: https://stackoverflow.com/questions/51201852/