我正在尝试使用 library(scales) 和 scale_color_gradientn() 创建颜色到连续变量的自定义映射,以试图限制效果我情节着色的异常值。这适用于单个图,但当我使用循环生成多个图并将它们存储在列表中时不起作用。
这是一个最小的工作示例:
library(ggplot2)
library(scales)

data1 <- as.data.frame(cbind(x = rnorm(100),
                             y = rnorm(100),
                             v1 = rnorm(100, mean = 2, sd = 1),
                             v2 = rnorm(100, mean = -2, sd = 1)))

#add outliers
data1[1,"v1"] <- 200
data1[2,"v1"] <- -200
data1[1,"v2"] <- 50
data1[2,"v2"] <- -50

#define color palette
cols <- colorRampPalette(c("#3540FF","black","#FF3535"))(n = 100)

#simple color scale
col2 <- scale_color_gradient2(low = "#3540FF",
                              mid = "black",
                              high = "#FF3535"
                              )

#outlier-adjusted color scale
{
    aa <- min(data1$v1)
    bb <- quantile(data1$v1, 0.05)
    cc <- quantile(data1$v1, 0.95)
    dd <- max(data1$v1)

    coln <- scale_color_gradientn(colors = cols[c(1,5,95,100)],
               values = rescale(c(aa,bb,cc,dd),
                    limits = c(aa,dd))
                                                                 )
}
情节:
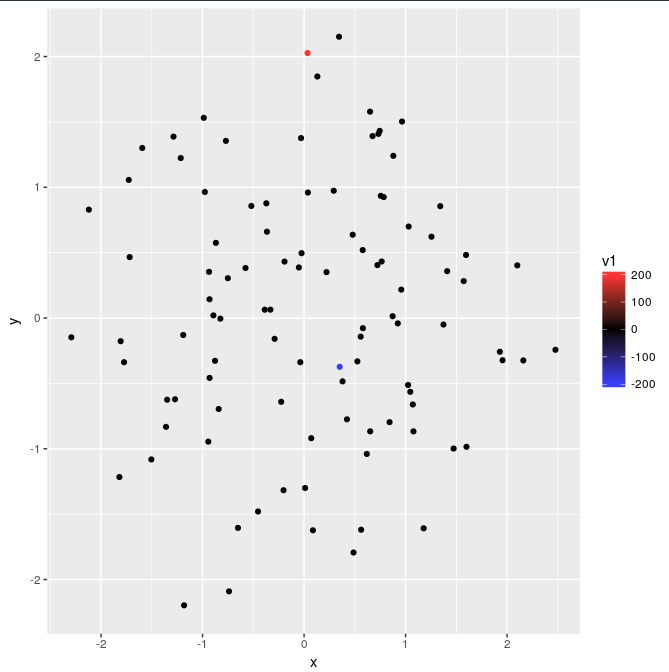
1.使用简单的尺度绘图 - 离群值导致尺度拉伸(stretch)。
ggplot(data1, aes(x = x, y = y, color = v1))+
   geom_point()+
   col2
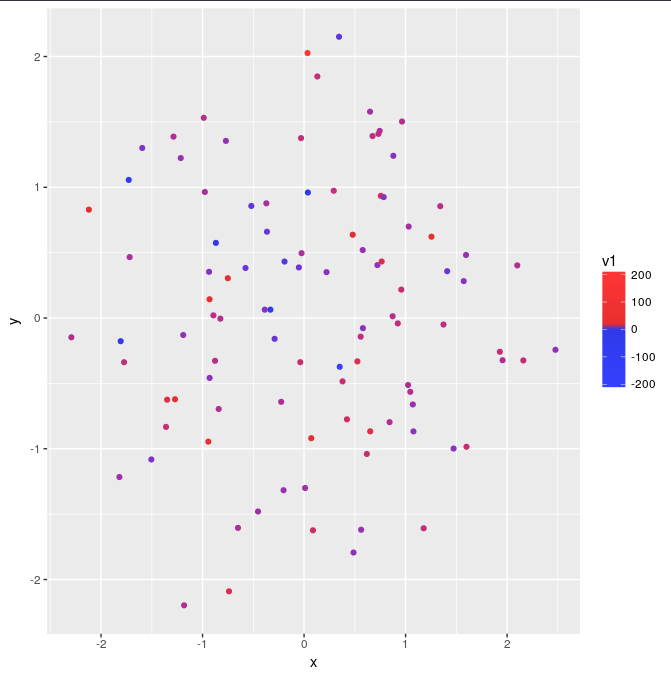
2。使用异常值调整比例绘制 - 正确的颜色比例。
ggplot(data1, aes(x = x, y = y, color = v1))+
    geom_point()+
    coln
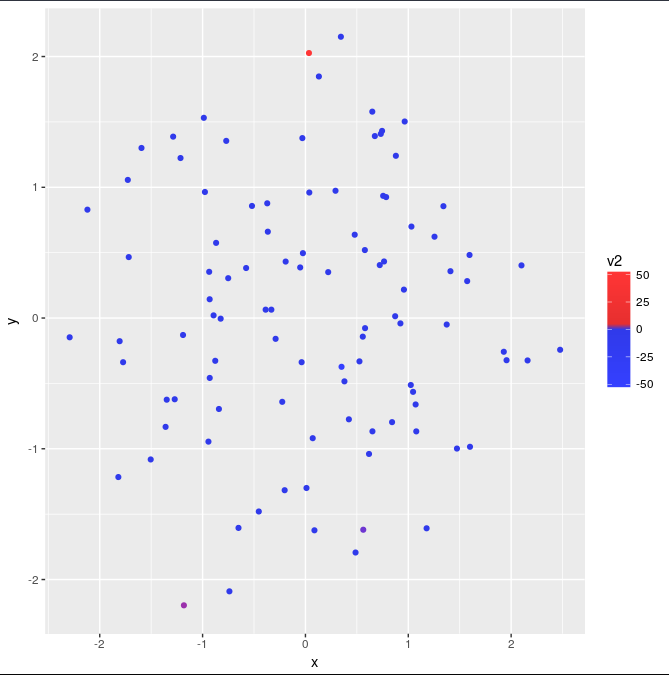
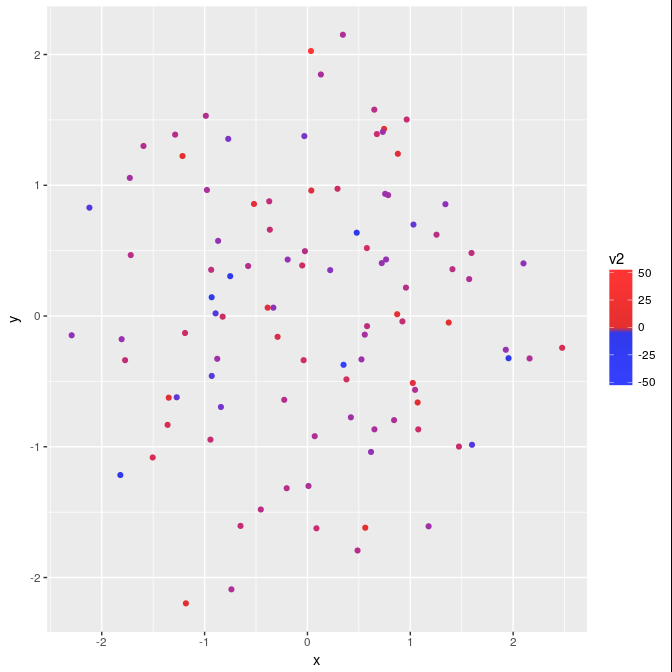
3。 v1 的比例不适用于 v2,因为数据不同。
ggplot(data1, aes(x = x, y = y, color = v2))+
    geom_point()+
    coln
#loop to produce list of plots each with own scale
{
    plots <- list()
    k <- 1
    for (i in c("v1","v2")){
        aa <- min(data1[,i])
        bb <- quantile(data1[,i],0.05)
        cc <- quantile(data1[,i], 0.95)
        dd <- max(data1[,i])

        colm <- scale_color_gradientn(colors = cols[c(1,5,95,100)],
                     values = rescale(c(aa,bb,cc,dd),
                         limits = c(aa,dd)))

        plots[[k]] <- ggplot(data1, aes_string(x = "x",
                                               y = "y",
                                                   color = i
                                                   ))+
                     geom_point()+
                     colm

        k <- k + 1
    }
}
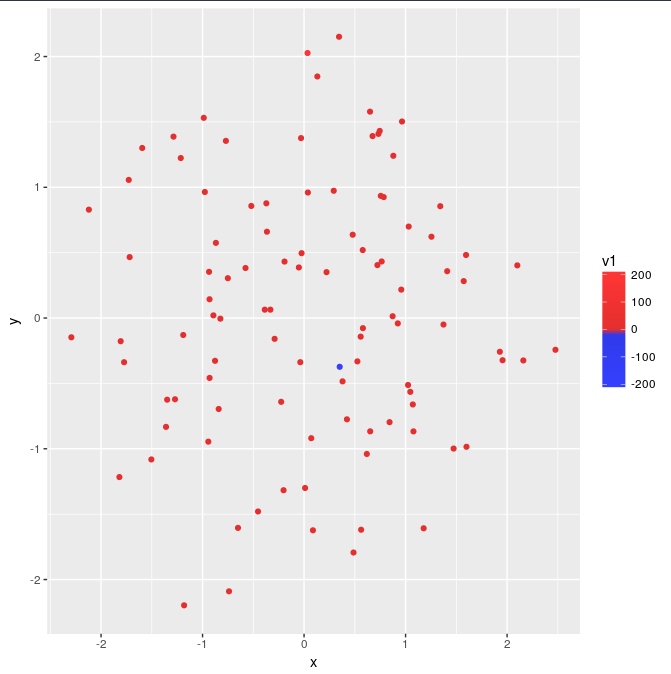
4.第一个图的比例错误。
plots[[1]]
5.第二个图具有正确的比例。
plots[[2]]
所以我猜测这与绘图发生时调用的 scale_color_gradientn() 函数有关,而不是在循环内调用。
如果有人可以提供帮助,我们将不胜感激。在 base R 中,我会将连续数据合并并将十六进制颜色分配到用于填充颜色的向量中,但我不确定如何在 ggplot 中应用它。
最佳答案
您需要使用闭包(具有关联环境的函数):
{
  plots <- list()
  k <- 1
  for (i in c("v1", "v2")){
    colm <- function() {
      aa <- min(data1[, i])
      bb <- quantile(data1[, i], 0.05)
      cc <- quantile(data1[, i], 0.95)
      dd <- max(data1[, i])

      scale_color_gradientn(colors = cols[c(1, 5, 95, 100)],
                            values = rescale(c(aa, bb, cc, dd),
                            limits = c(aa, dd)))
    }

    plots[[k]] <- ggplot(data1, aes_string(x = "x",
                                           y = "y",
                                           color = i)) +
                    geom_point() +
                    colm()
    k <- k + 1
  }
}

plots[[1]]

plots[[2]]

关于r - 使用 scale_color_gradientn 在 ggplot2 中生成的绘图列表着色错误,我们在Stack Overflow上找到一个类似的问题: https://stackoverflow.com/questions/48948586/