是否可以在 R 中生成多行对应单行的表格?并将结果表写入 pdf。示例表如下。
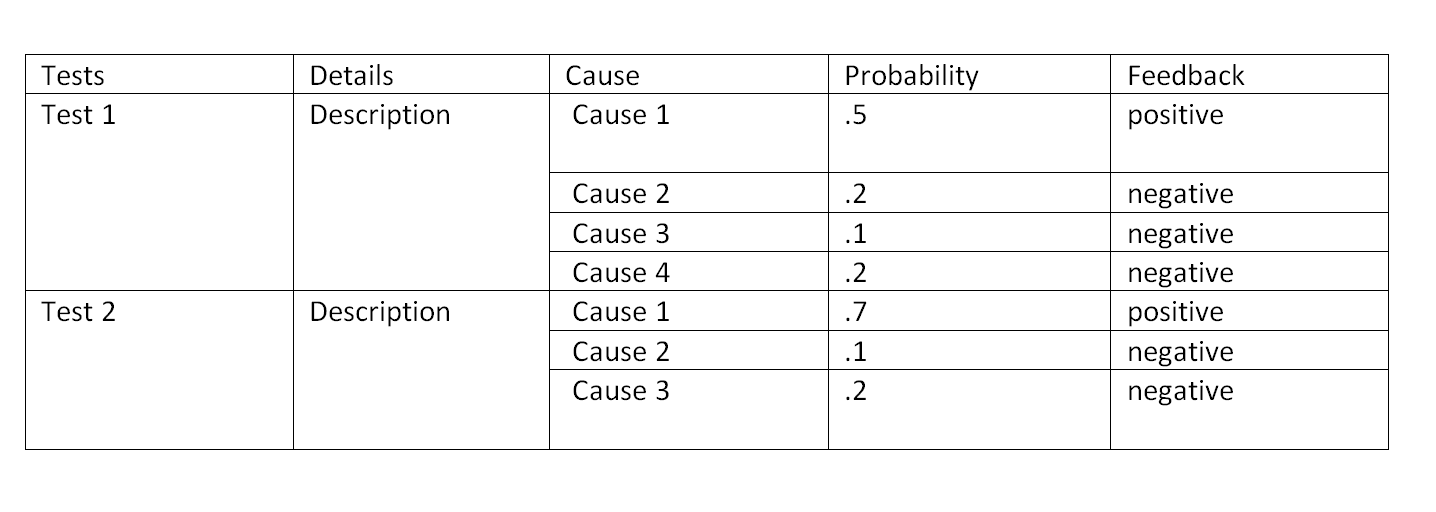
是否可以按照图像中显示的方式连接两个单独的表。 下面给出了两个表的示例代码
tab1="Test Description
1 test1 description
2 test2 description"
table1 <-read.table(text = tab1,header = TRUE)

tab21="Cause Probability Feedback
1 cause1 .5 positive
2 Cause2 .2 negative
3 Cause3 .1 negative
4 Cause4 .2 negative"
table2 <-read.table(text = tab21,header = TRUE)

tab22="Cause Probability Feedback
1 cause1 .7 positive
2 Cause2 .2 negative
3 Cause3 .1 negative"
table3 <-read.table(text = tab22,header = TRUE)
最佳答案
这有点棘手,但我会利用 print.xtable 函数将具有 NA 的单元格打印为空的事实。单元格并未真正“合并”,但当内容与顶部对齐时看起来像这样。
基本上步骤是:
- 在 R 中生成合适的 data.frame
- 使用包“xtable”中的 print.xtable 将其打印为 .tex 兼容表
- 使用 Sweave/knitr/etc 生成合适的 .tex
- tools::texi2pdf 然后会将您的 .tex 转换为合适的 .pdf
这是文件,您只需要在 R 终端中获取 RunSweave.R(并确保您安装了 LaTeX 以及所需的包,即 'xtable 并将文件放在一个文件夹中;这是运行在 Windows 中)。
文件StackExampleCode.R:
# StackExampleCode.R
library(xtable)

# A work-around by setting rows in the multi-row to NA after the initial top-justified line
header <- data.frame(test = "Tests", det = "Details", cause = "Cause", prob = "Probability", fb = "Feedback")
# Filling the fields for these is something you'd probably want to do in R in a more sophisticated manner
test1 <- data.frame(
    test = c("Test 1", NA, NA, NA, NA),
    det = c("Description", NA, NA, NA, NA),
    cause = c("Cause 1", NA, paste("Cause", 2:4)),
    prob = c(".5", NA, ".2", ".1", ".2"),
    fb = c("positive", NA, "negative", "negative", "negative")
)
test2 <- data.frame(
    test = c("Test 2", NA, NA, NA),
    det = c("Description", NA, NA, NA),
    cause = c(paste("Cause", 1:3), NA),
    prob = c(".7", ".1", ".2", NA),
    fb = c("positive", "negative", "negative", NA)
)
# Bind it all together, you probably want something similar if it's automatic data you're generating
tab <- rbind(header, test1, test2)
文件StackExampleRnw.Rnw:
% StackExampleRnw.Rnw
% Note the different comment char, writing .tex here
\documentclass{article}

\begin{document}

<<echo=FALSE, results=tex>>=
# Printing the table
print(
    xtable(tab,
        align = "|l|l|l|l|l|l|" # Create the desired vertical lines and text alignments ala LaTeX; left align with vertical lines in-between each column)
    ),
    add.to.row = list( # Add horizontal lines to correct spots, should be adjusted according to the desired data
        pos = list(-1, 1, 6, nrow(tab)),
        command = c("\\hline \n", "\\hline \n", "\\hline \n", "\\hline \n") # Horizontal lines and a neater formatting of output using a linechange
    ),
    include.rownames = FALSE, # Don't include the rownames (which would be just numbers)
    include.colnames = FALSE, # Don't include the rownames, these were already included as if it was an ordinary table row
    hline.after = NULL # Suppress the empty horizontal line that is intended for an automated caption
)
@
\end{document}
文件RunSweave.R:
# RunSweave.R

# Run the code
source("StackExampleCode.R")
# Bundle R code with LaTeX
Sweave("StackExampleRnw.Rnw")
# .tex -> .pdf
tools::texi2pdf("StackExampleRnw.tex")
这是我在 StackExampleRnw.pdf 中的样子:

或者,您可以直接访问 StackExampleRnw.tex 文件中 .tex 格式的表格,如果您愿意,可以进行一些额外的格式化。以上不需要在 .tex 中进行任何额外的修改,但您需要确保将水平线和 NA 放在正确的位置。
如果您对 .tex 不满意,print.xtable 函数有大量参数可用于进一步格式化。如果右边三列中的部分水平线对您来说真的很重要,我可能会把它分成两个表,然后将它们水平粘合在一起,并在右边的每行中有一条水平线。
关于r - r 中的表具有多个子行并写入 pdf,我们在Stack Overflow上找到一个类似的问题: https://stackoverflow.com/questions/38116957/