是否有任何函数等可以避免散点图中相同数据点的数据标签重叠?
我已经检查了对 textxy、direct.label 和 geom_text() 的各种问题/回复,但我没有成功。也许这根本不可能。
以下是相关数据的示例:
structure(list(cowc = structure(c(5L, 7L, 24L, 24L, 23L, 36L,
34L, 38L, 23L, 6L, 8L, 38L, 38L, 23L, 5L, 7L, 24L, 24L, 23L,
36L, 34L, 38L, 23L, 6L, 8L, 38L, 38L, 23L), .Label = c("AFG",
"ANG", "AZE", "BNG", "BOS", "BUI", "CAM", "CDI", "CHA", "COL",
"CRO", "DOM", "DRC", "ETH", "GNB", "GRG", "GUA", "IND", "INS",
"IRQ", "KEN", "LAO", "LBR", "LEB", "MAL", "MLD", "MZM", "NEP",
"NIC", "PHI", "PNG", "RUS", "RWA", "SAF", "SAL", "SIE", "SOM",
"SUD", "TAJ", "UKG", "YAR", "ZIM"), class = "factor"), conflict = c("Bosnia 92-95",
"Cambodia 70-91", "Lebanon 58-58", "Lebanon 75-89", "Liberia 89-93",
"SieLeo 91-96", "Stafrica 83-91", "Sudan 63-72", "Liberia 94-96",
"Burundi 1993-2005", "Cote d'Ivoire 2002-2007", "Darfur, Sudan 2003-2010",
"Sudan 83-05", "Liberia 1999-2003", "Bosnia 92-95", "Cambodia 70-91",
"Lebanon 58-58", "Lebanon 75-89", "Liberia 89-93", "SieLeo 91-96",
"Stafrica 83-91", "Sudan 63-72", "Liberia 94-96", "Burundi 1993-2005",
"Cote d'Ivoire 2002-2007", "Darfur, Sudan 2003-2010", "Sudan 83-05",
"Liberia 1999-2003"), totalps = c(3L, 2L, 2L, 2L, 1L, 3L, 4L,
3L, 1L, 3L, 3L, 4L, 3L, 3L, 3L, 2L, 2L, 2L, 1L, 3L, 4L, 3L, 1L,
3L, 3L, 4L, 3L, 3L), vetotype = structure(c(1L, 1L, 1L, 1L, 1L,
1L, 1L, 1L, 1L, 1L, 1L, 1L, 1L, 1L, 2L, 2L, 2L, 2L, 2L, 2L, 2L,
2L, 2L, 2L, 2L, 2L, 2L, 2L), .Label = c("strictvetos", "lenientvetos"
), class = "factor"), intensity = c(3L, 4L, 2L, 5L, 2L, 2L, 2L,
2L, 2L, 3L, 2L, 2L, 2L, 2L, 3L, 4L, 2L, 6L, 2L, 2L, 4L, 2L, 2L,
3L, 3L, 2L, 2L, 2L)), .Names = c("cowc", "conflict", "totalps",
"vetotype", "intensity"), class = "data.frame", row.names = c(NA,
-28L))
这是我的代码:
vetotype.plot <- ggplot(vetotype.x, aes(x=totalps, y=intensity, color=conflict))+
      geom_point() +
      labs(x="number of power-sharing arenas", y="intensity") +
      ggtitle("Number of Power-Sharing areas and Veto intensity") +
      geom_text(aes(label=conflict),hjust=0, vjust=0, size=4)+
      scale_x_continuous(limits=c(1, 5))+
      theme(legend.position="none")+
      facet_wrap(~vetotype, nrow=2)

plot(vetotype.plot)
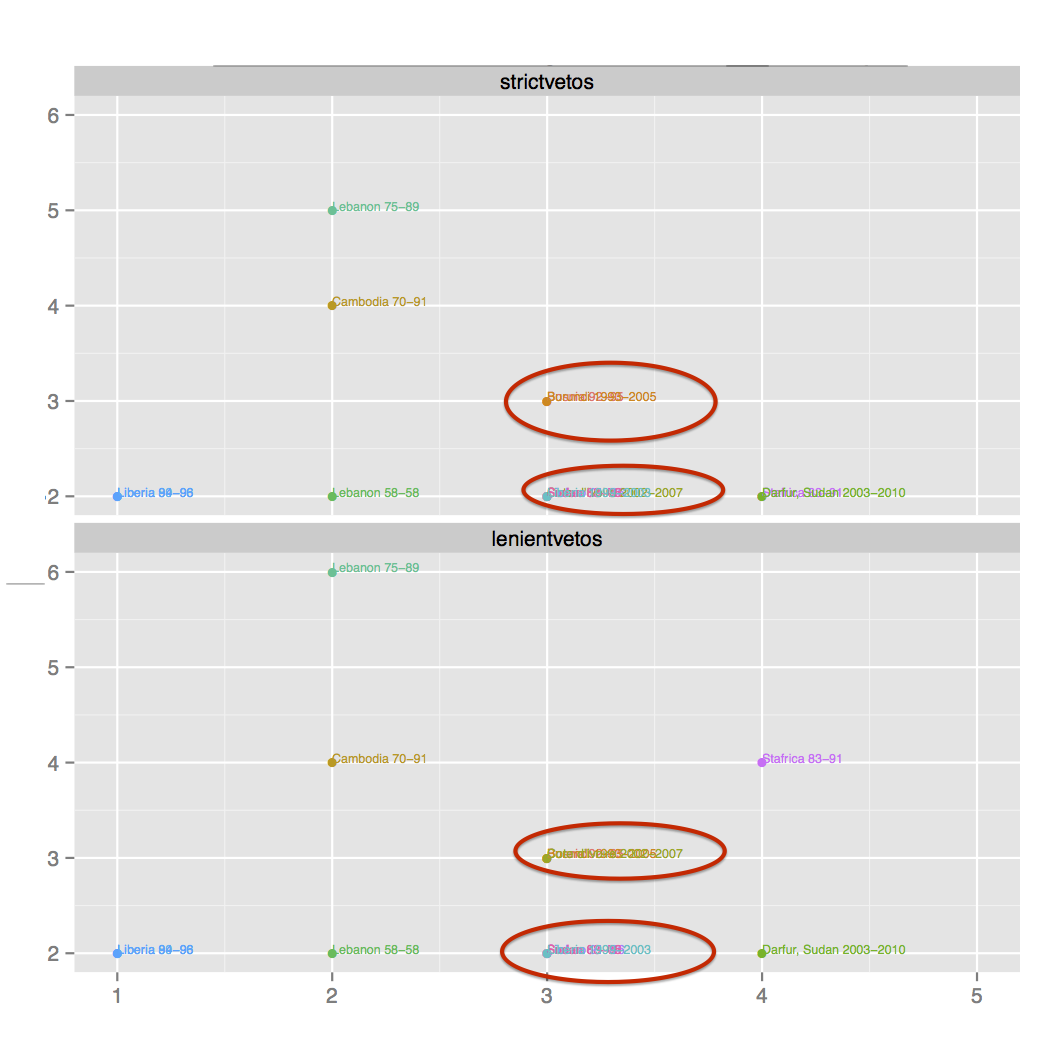
下面是我的图表。我手动突出显示了那些重叠的数据点。
我正在寻找的是一种“自动”方式来获取重叠数据点的标签显示方式,以便它们不重叠。是否有任何功能用于此目的?非常感谢!
最佳答案
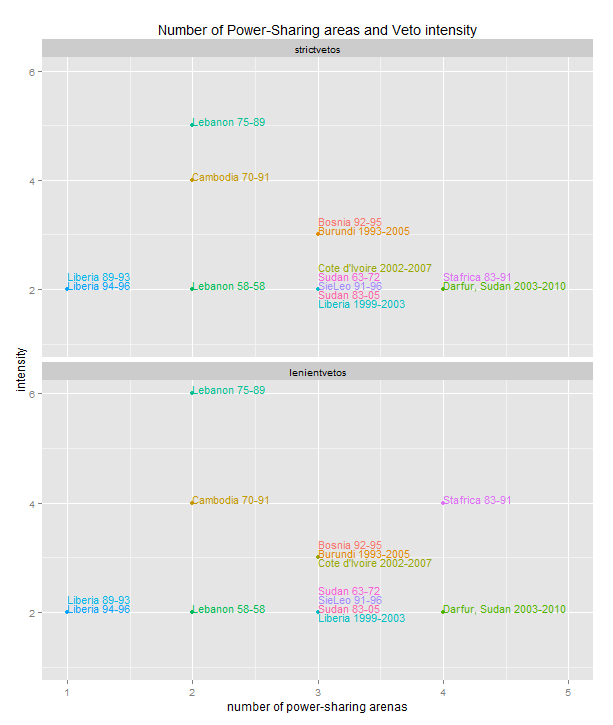
这不是一个完全通用的解决方案,但它似乎适用于您的情况。
library(ggplot2)
# identify duplicated points
dupes <- aggregate(conflict~totalps+intensity+vetotype,vetotype.x,length)
colnames(dupes)[4] = "dupe"
df <- merge(vetotype.x,dupes)   # add dupe column
df$vjust <- 0                   # default vertical offset is 0
# calculate vertical offsets based on number of dupes
for (i in 2:max(df$dupe)) df[df$dupe==i,]$vjust<-seq(-trunc(i/2),-trunc(i/2)+i-1)
# render the plot
vetotype.plot <- ggplot(df, aes(x=totalps, y=intensity, color=conflict))+
  geom_point() +
  labs(x="number of power-sharing arenas", y="intensity") +
  ggtitle("Number of Power-Sharing areas and Veto intensity") +
  geom_text(aes(label=conflict,vjust=vjust), hjust=0,size=4)+
  scale_x_continuous(limits=c(1, 5))+
  scale_y_continuous(limits=c(1, 6))+
  theme(legend.position="none")+
  facet_wrap(~vetotype, nrow=2)

plot(vetotype.plot)
关于r - 如何避免在散点图/ggplot 中具有相同数据点的标签重叠?,我们在Stack Overflow上找到一个类似的问题: https://stackoverflow.com/questions/21585128/