我想做一个垂直直方图。理想情况下,我应该能够每天在一个地块上放置多个。
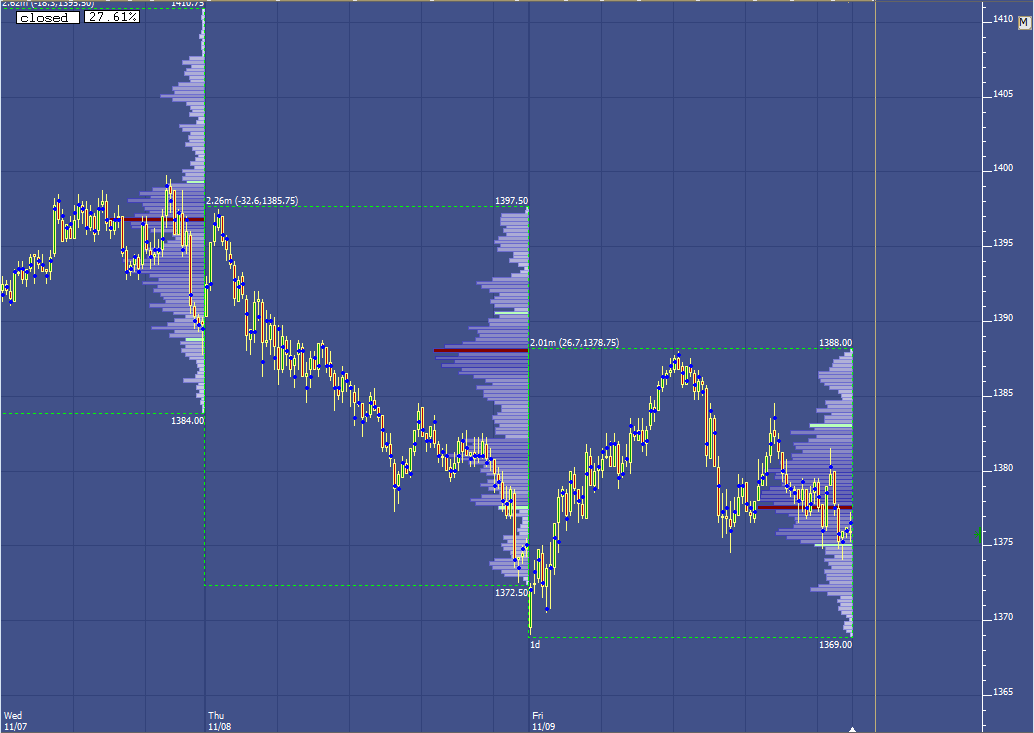
如果这可以与 quantmod 实验 chart_Series 或其他一些能够为时间序列绘制条形图的库结合使用,那就太好了。请参阅随附的屏幕截图。理想情况下,我可以绘制这样的图。
有什么内置或现有的库可以帮助解决这个问题吗?
最佳答案
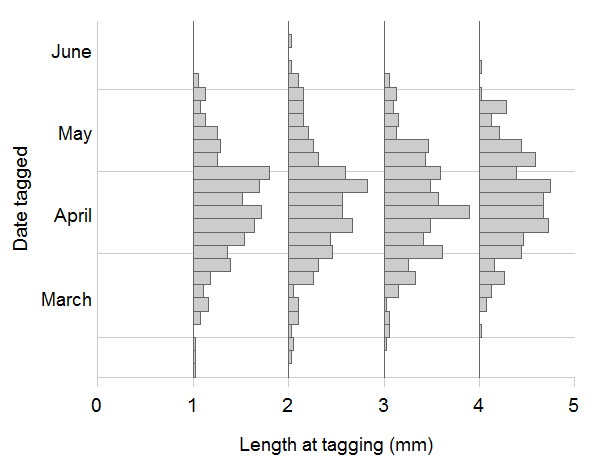
大约一年前我写了一些东西来在基本图形中做垂直直方图。在这里,有一个使用示例。
VerticalHist <- function(x, xscale = NULL, xwidth, hist,
                         fillCol = "gray80", lineCol = "gray40") {
    ## x (required) is the x position to draw the histogram
    ## xscale (optional) is the "height" of the tallest bar (horizontally),
    ##   it has sensible default behavior
    ## xwidth (required) is the horizontal spacing between histograms
    ## hist (required) is an object of type "histogram"
    ##    (or a list / df with $breaks and $density)
    ## fillCol and lineCol... exactly what you think.
    binWidth <- hist$breaks[2] - hist$breaks[1]
    if (is.null(xscale)) xscale <- xwidth * 0.90 / max(hist$density)
    n <- length(hist$density)
    x.l <- rep(x, n)
    x.r <- x.l + hist$density * xscale
    y.b <- hist$breaks[1:n]
    y.t <- hist$breaks[2:(n + 1)]

    rect(xleft = x.l, ybottom = y.b, xright = x.r, ytop = y.t,
         col = fillCol, border = lineCol)
}


## Usage example
require(plyr) ## Just needed for the round_any() in this example
n <- 1000
numberOfHists <- 4
data <- data.frame(ReleaseDOY = rnorm(n, 110, 20),
                   bin = as.factor(rep(c(1, 2, 3, 4), n / 4)))
binWidth <- 1
binStarts <- c(1, 2, 3, 4)
binMids <- binStarts + binWidth / 2
axisCol <- "gray80"

## Data handling
DOYrange <- range(data$ReleaseDOY)
DOYrange <- c(round_any(DOYrange[1], 15, floor),
                      round_any(DOYrange[2], 15, ceiling))

## Get the histogram obects
histList <- with(data, tapply(ReleaseDOY, bin, hist, plot = FALSE,
    breaks = seq(DOYrange[1], DOYrange[2], by = 5)))
DOYmean <- with(data, tapply(ReleaseDOY, bin, mean))

## Plotting
par(mar = c(5, 5, 1, 1) + .1)
plot(c(0, 5), DOYrange, type = "n",
     ann = FALSE, axes = FALSE, xaxs = "i", yaxs = "i")

axis(1, cex.axis = 1.2, col = axisCol)
mtext(side = 1, outer = F, line = 3, "Length at tagging (mm)",
      cex = 1.2)
axis(2, cex.axis = 1.2, las = 1, line = -.7, col = "white",
    at = c(75, 107, 138, 169),
    labels = c("March", "April", "May", "June"), tck = 0)
mtext(side = 2, outer = F, line = 3.5, "Date tagged", cex = 1.2)
box(bty = "L", col = axisCol)

## Gridlines
abline(h = c(60, 92, 123, 154, 184), col = "gray80")

biggestDensity <- max(unlist(lapply(histList, function(h){max(h[[4]])})))
xscale <- binWidth * .9 / biggestDensity

## Plot the histograms
for (lengthBin in 1:numberOfHists) {
    VerticalHist(binStarts[lengthBin], xscale = xscale,
                         xwidth = binWidth, histList[[lengthBin]])
    }
关于r - 垂直直方图,我们在Stack Overflow上找到一个类似的问题: https://stackoverflow.com/questions/13327489/