我正在尝试开发一个使用 1 个度量和 3 个维度来可视化数据的图表。我将一个维度放在 x 轴上,一个作为堆栈,一个作为系列列表。
HighCharts 具有我用作基础的堆叠分组柱形图。见我的jsfiddle .
    series: [{
        name: 'John',
        color: '#ff4400',
        data: [5, 3, 4, 7, 2],
        stack: '2014'
    }, {
        name: 'Joe',
        color: '#44ff00',
        data: [3, 4, 4, 2, 5],
        stack: '2014'
    }, {
        name: 'John',
        color: '#ff4400',
        data: [2, 5, 6, 2, 1],
        showInLegend: false,
        stack: '2015'
    }, {
        name: 'Joe',
        data: [3, 0, 4, 4, 3],
        color: '#44ff00',
        showInLegend: false,
        stack: '2015'
    }]
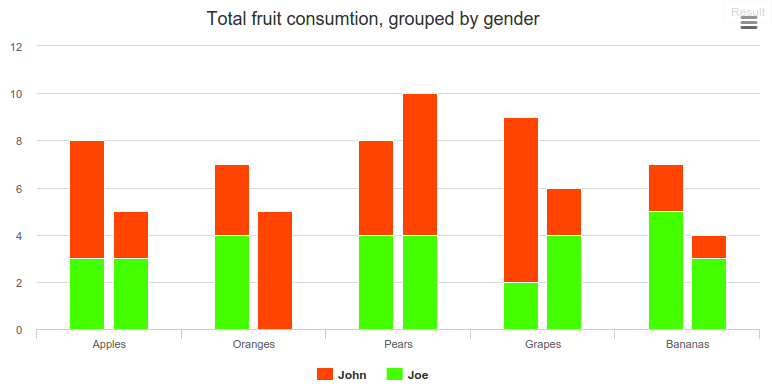
我希望能够在第二级 x 轴上显示 堆栈名称。我知道 group-plugin ,但这似乎不适用于堆栈。
有什么提示吗?
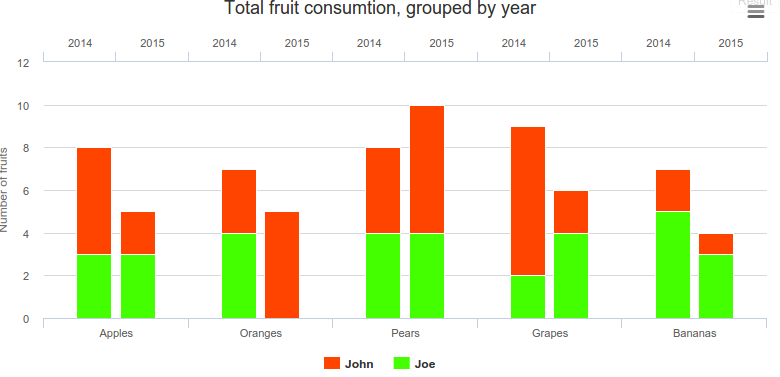
最佳答案
这可能不是最好的解决方案(所以请继续前进),但我现在伪造了一个数据序列。
  xAxis: [{
            categories: ['Apples', 'Oranges', 'Pears', 'Grapes', 'Bananas']
        },
               {
            categories: ['2014', '2015', '2014', '2015', '2014', '2015','2014', '2015', '2014', '2015'],
                   opposite: true
        }],
  series: [{
        name: 'John',
        color: '#ff4400',
        data: [5, 3, 4, 7, 2],
        stack: '2014',

    }, {
        name: 'Joe',
        color: '#44ff00',
        data: [3, 4, 4, 2, 5],
        stack: '2014',

    }, {
        name: 'John',
        color: '#ff4400',
        data: [2, 5, 6, 2, 1],
        showInLegend: false,
        stack: '2015'
    }, {
        name: 'Joe',
        data: [3, 0, 4, 4, 3],
        color: '#44ff00',
        showInLegend: false,
        stack: '2015'
    }, {
        name: '',
        data: [0, 0, 0,0, 0, 0,0, 0, 0,0],
        showInLegend: false,
        stack: '2015',
        xAxis: 1
    }]
结果:
更新
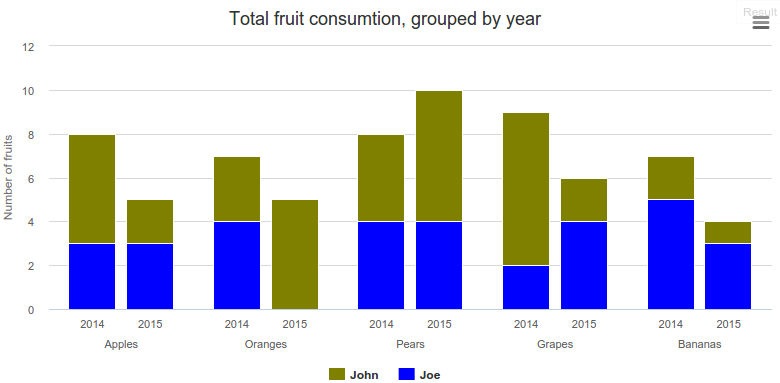
关于javascript - Highcharts 堆栈组列的正确 x 轴,我们在Stack Overflow上找到一个类似的问题: https://stackoverflow.com/questions/31028330/