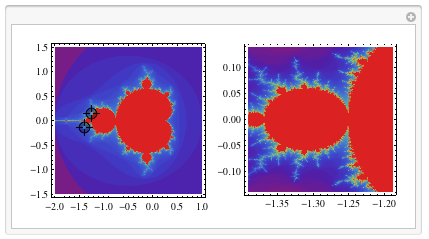
我试图有两个面板,左边显示一个图形和两个定位器,右边一个是定位器定义的区域中的放大版本。
我试过了
ClearAll[mndpt];
mndpt = Compile[{{c, _Complex}, {maxiter, _Integer}},
   Module[{z, iters},
        iters = 0.;
        z = c;
            While[(iters < maxiter) && (Abs@z < 2),
                iters++;
                z = z^2 + c];
        Sqrt[iters/maxiter]],
   {{z, _Complex}},
   CompilationTarget \[Rule] "C",
   RuntimeOptions \[Rule] "Speed"];
做
Manipulate[
 Grid[
  {{DensityPlot[mndpt[x + y*I, 200],
        {x, -2, 1}, {y, -1.5, 1.5},
        PlotRange \[Rule] {0, 1}, PlotPoints \[Rule] 80,
     ColorFunction \[Rule] "Rainbow"],
    DensityPlot[mndpt[x + y*I, 200],
        Dynamic@{x, p1[[1]], p2[[1]]}, Dynamic@{y, p1[[2]], p2[[2]]},
        PlotRange \[Rule] {0, 1}, PlotPoints \[Rule] 80,
     ColorFunction \[Rule] "Rainbow"]}}],
 {{p1, {-1, -1}}, Locator}, {{p2, {0, 1}}, Locator}]
然后右侧面板不起作用:

我的问题是,为什么会这样?如您所见,它提示“DensityPlot::pllim: Range specification {x,-1,0} 不是 {x, xmin, xmax} 的形式。”我觉得这很令人费解。事实上,我普遍感到困惑。到底是怎么回事?某种范围界定问题?评价问题?我怎样才能让它工作?这可能很简单,但我从来没有真正理解过这个前端的东西。
编辑:事实证明,这个问题是由于我的愚蠢(希望是暂时的)急剧增加。正如西蒙在评论中指出的那样,删除两个
Dynamics (我为了完成这项工作而盲目地添加了它)使一切正常。那是, Manipulate[
Grid[
{{DensityPlot[mndpt[x + y*I, 200],
{x, -2, 1}, {y, -1.5, 1.5},
PlotRange \[Rule] {0, 1}, PlotPoints \[Rule] 80,
ColorFunction \[Rule] "Rainbow"],
DensityPlot[mndpt[x + y*I, 200],
{x, p1[[1]], p2[[1]]},{y, p1[[2]], p2[[2]]},
PlotRange \[Rule] {0, 1}, PlotPoints \[Rule] 80,
ColorFunction \[Rule] "Rainbow"]}}],
{{p1, {-1, -1}}, Locator}, {{p2, {0, 1}}, Locator}]
做正确的事:
所以,谁知道为什么我前几次做了,所以它没有用。
另一方面,原始案例中的消息,即“DensityPlot::pllim: Range specification {x,-1,0} is not the form {x, xmin, xmax}。”更令人费解。我认为 Leonid 已经解释过了,也在评论中(简而言之,尝试
ClearAttributes[Dynamic, ReadProtected] 然后 ??Dynamic 你可以看到有一个定义 Dynamic/:MakeBoxes[BoxForm`x$_Dynamic,StandardForm]:= 等)。由于我对前端编程的理解可以忽略不计,我不会在这里解释它,所以如果有人确实发布了解释这一点的答案,将不胜感激。
最佳答案
正如对问题的评论中所讨论的,如果 Dynamic s 从第二个 DensityPlot 的范围中删除. Dynamic Manipulate 的主体中通常不需要 s因为它自动包装在动态构造中。虽然,为了更细粒度地控制表达式更新的哪些部分,使用 Dynamic inside of a Manipulate 会很有用。 .
创建错误的原因是绘图的范围应为 {x, xmin, xmax} 形式。与 x一个 Symbol和 xmin和 xmax数字。包装 Dynamic围绕列表改变头部并打破情节。
错误不明显的原因是错误消息有点困惑:
Range specification {x,-1,0} is not of the form {x, xmin, xmax}.
表面上看起来很疯狂,但一旦你意识到(正如 Leonid 所指出的)
Dynamic是具有 MakeBoxes 的包装器输出到笔记本时使其不可见的定义。要看到这一点,请看In[1]:= FormatValues[Dynamic]
Out[1]= {HoldPattern[MakeBoxes[BoxForm`x$_Dynamic, StandardForm]] :> (DynamicModule;
DynamicDump`ControlToBoxes[BoxForm`x$, StandardForm]),
<<snip: same but for TraditionalForm>>}
和
ControlToBoxes反过来,创建一个 DynamicBox目的。这也可以通过输入 Dynamic[x] 来查看。并使用单元格菜单或 Show Expression 的快捷方式生成的输出单元格 - 您还可以查看错误消息的基本表达式并查看 DynamicBox在那里施工。也可以Unprotect并删除 MakeBoxes Dynamic的定义,但这破坏了 Mathematica 中的大部分动态功能......最后,这是我的代码版本:
mndpt = Compile[{{c, _Complex}, {maxiter, _Integer}},
Module[{z = c, iters = 0.0},
While[(iters < maxiter) && (Abs@z < 2), iters++; z = z^2 + c];
Sqrt[iters/maxiter]], CompilationTarget -> "C",
RuntimeOptions -> "Speed"];
opts = Sequence[PlotPoints -> 80, ColorFunction -> "Rainbow",
ImageSize -> Medium, ImagePadding -> {{30, 5}, {20, 5}}];
fixed = DensityPlot[mndpt[x + y*I, 200], {x, -2, 1}, {y, -1.5, 1.5},
PlotPoints -> 120, Evaluate[opts]];
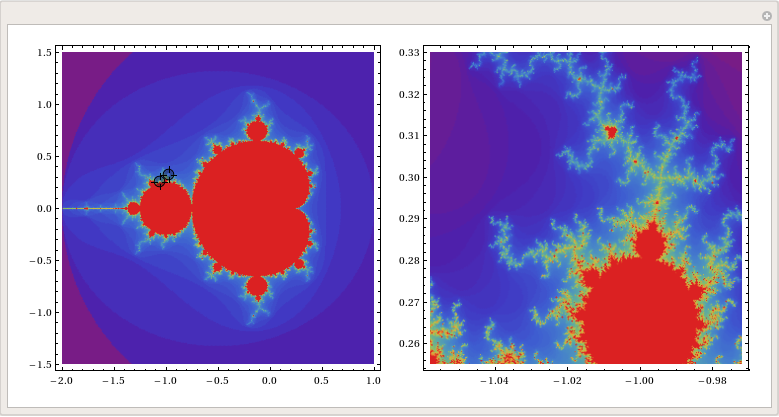
Manipulate[Grid[{{fixed, DensityPlot[mndpt[x + y*I, 200],
{x, p[[1, 1]], p[[2, 1]]}, {y, p[[1, 2]], p[[2, 2]]}, Evaluate[opts]]}}],
{{p, {{-1, -1}, {0, 1}}}, Locator, ContinuousAction -> False}]
关于动态交互问题,我们在Stack Overflow上找到一个类似的问题: https://stackoverflow.com/questions/6723548/