标题几乎说明了一切。我正在寻找一种方便的方法来生成定义椭圆的 geoJSON 多边形,类似于 d3-geo 的 d3.geoCircle()(); 我想将此 GeoJSON 椭圆与 d3-geo 一起使用。为了举例说明,Cesium 有这个 capability使用一个简单的函数,您可以像这样创建一个椭圆:
var ellipse = new Cesium.EllipseGeometry({
  center : Cesium.Cartesian3.fromDegrees(-75.59777, 40.03883),
  semiMajorAxis : 500000.0,
  semiMinorAxis : 300000.0,
  rotation : Cesium.Math.toRadians(60.0)
});
如果该函数返回 GeoJSON,我将被设置。生成定义椭圆的 GeoJSON 多边形的最佳方法是什么?
最佳答案
D3 在这方面没有提供任何真正有用的东西。 Vanilla javascript 可以很容易地实现这一点。首先让我们在笛卡尔坐标空间中创建一个 geojson 椭圆。之后,我们就可以用haversine公式来画椭圆了。
- 在笛卡尔坐标空间中创建一个 geojson 椭圆。
这很简单,我使用的方法是计算给定 Angular 椭圆的半径。使用这些极坐标,我们可以将椭圆缝合在一起。可以很容易地找到给定点处的椭圆半径的公式,我使用了这个 source ,这给了我们:
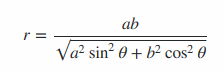
因此,我们可以轻松地遍历一系列 Angular ,计算出该 Angular 半径,然后将这个极坐标转换为笛卡尔坐标。也许是这样的:
function createEllipse(a,b,x=0,y=0,rotation=0) {

  rotation = rotation / 180 * Math.PI;
  var n = n = Math.ceil(36 * (Math.max(a/b,b/a))); // n sampling angles, more for more elongated ellipses
  var coords = [];

  for (var i = 0; i <= n; i++) {
    // get the current angle
    var θ = Math.PI*2/n*i + rotation;

    // get the radius at that angle
    var r = a * b / Math.sqrt(a*a*Math.sin(θ)*Math.sin(θ) + b*b*Math.cos(θ)*Math.cos(θ));

    // get the x,y coordinate that marks the ellipse at this angle
    x1 = x + Math.cos(θ-rotation) * r;
    y1 = y + Math.sin(θ-rotation) * r;

    coords.push([x1,y1]);
  }

  // return a geojson object:
  return { "type":"Polygon", "coordinates":[coords] };

}
注意:a/b:轴(以像素为单位),x/y:中心(以像素为单位),rotation:以度为单位的旋转
这是一个简短的片段:
var geojson = createEllipse(250,50,200,200,45);

var svg = d3.select("body")
  .append("svg")
  .attr("width",600)
  .attr("height",500);

var path = d3.geoPath();

svg.append("path")
 .datum(geojson)
 .attr("d",path);


function createEllipse(a,b,x=0,y=0,rotation=0) {

	rotation = rotation / 180 * Math.PI;
	var n = n = Math.ceil(36 * (Math.max(a/b,b/a))); // n sample angles
	var coords = [];

	for (var i = 0; i <= n; i++) {
	    // get the current angle
		var θ = Math.PI*2/n*i + rotation;

		// get the radius at that angle
		var r = a * b / Math.sqrt(a*a*Math.sin(θ)*Math.sin(θ) + b*b*Math.cos(θ)*Math.cos(θ));

		// get the x,y coordinate that marks the ellipse at this angle
		x1 = x + Math.cos(θ-rotation) * r;
		y1 = y + Math.sin(θ-rotation) * r;

		coords.push([x1,y1]);
	}

	// return a geojson object:
	return { "type":"Polygon", "coordinates":[coords] };

}
<script src="https://cdnjs.cloudflare.com/ajax/libs/d3/4.13.0/d3.min.js"></script>- 应用 haversine 公式。
据我所知,关于半正弦函数和相关函数的最佳资源之一位于 Moveable Type Scripts。 .几年前我从那里得到的配方进行了一些美容修改。我不打算在这里分解公式,因为链接引用应该很有用。
所以,与其计算笛卡尔坐标,不如取极坐标,在半正弦公式中用 Angular 作为方位 Angular ,半径作为距离,这应该是比较简单的。
这看起来像:
function createEllipse(a,b,x=0,y=0,rotation=0) {
var k = Math.ceil(36 * (Math.max(a/b,b/a))); // sample angles
var coords = [];
for (var i = 0; i <= k; i++) {
// get the current angle
var angle = Math.PI*2 / k * i + rotation
// get the radius at that angle
var r = a * b / Math.sqrt(a*a*Math.sin(angle)*Math.sin(angle) + b*b*Math.cos(angle)*Math.cos(angle));
coords.push(getLatLong([x,y],angle,r));
}
return { "type":"Polygon", "coordinates":[coords] };
}
function getLatLong(center,angle,radius) {
var rEarth = 6371000; // meters
x0 = center[0] * Math.PI / 180; // convert to radians.
y0 = center[1] * Math.PI / 180;
var y1 = Math.asin( Math.sin(y0)*Math.cos(radius/rEarth) + Math.cos(y0)*Math.sin(radius/rEarth)*Math.cos(angle) );
var x1 = x0 + Math.atan2(Math.sin(angle)*Math.sin(radius/rEarth)*Math.cos(y0), Math.cos(radius/rEarth)-Math.sin(y0)*Math.sin(y1));
y1 = y1 * 180 / Math.PI;
x1 = x1 * 180 / Math.PI;
return [x1,y1];
}
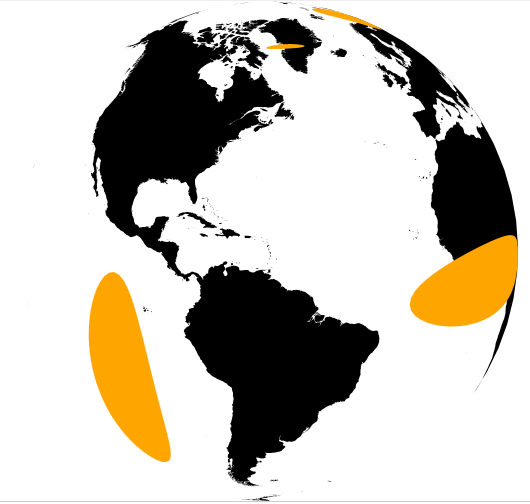
// Create & Render the geojson:
var geojson = createEllipse(500000,1000000,50,70); // a,b in meters, x,y, rotation in degrees.
var geojson2 = createEllipse(500000,1000000)
var svg = d3.select("body")
.append("svg")
.attr("width",600)
.attr("height",400);
var g = svg.append("g");
var projection = d3.geoMercator().translate([300,200]).scale(600/Math.PI/2);
var path = d3.geoPath().projection(projection);
g.selectAll("path")
.data([geojson,geojson2])
.enter().append("path")
.attr("d", path);
g.selectAll("circle")
.data([[50,70],[0,0]])
.enter().append("circle")
.attr("cx", function(d) { return projection(d)[0] })
.attr("cy", function(d) { return projection(d)[1] })
.attr("r", 4)
.attr("fill","orange");<script src="https://cdnjs.cloudflare.com/ajax/libs/d3/4.13.0/d3.min.js"></script>注意:a/b 轴以米为单位,x、y、旋转以度为单位
这可能是一个非常无聊的演示 this simple demonstration更好:
我使用的公式假设地球是一个球体,而不是椭圆体,这可能导致距离误差高达 0.3%。但是,根据 map 比例,这通常会小于笔划宽度。
我可能不得不尝试用这个制作一个特别具有视觉挑战性的天梭指示器
代码段使用与 IE 不兼容的默认参数值,示例 block 提供 IE 支持
关于javascript - d3 GeoJSON geoCircle 椭圆等效,我们在Stack Overflow上找到一个类似的问题: https://stackoverflow.com/questions/50594891/