我正在尝试将美国 map 拆分为多个窗口(其中一些包含两次相同的州)。我希望比例保持不变(这样 map 不会失真),但也要尽量减少 map 之间的空间。我不能使用 facet_wrap (由于区域的重叠性质——无论如何,facet_wrap 不能同时具有固定的比例并且每个窗口都有不同的 xlim)。关于如何改善结果间距的任何建议?
require(data.table)
require(ggplot2)
require(maps)
require(gridExtra)
all_states <- as.data.table(map_data("state"))

setnames(all_states,"region","state")

##define regions with overlapping states
weco.states <- c("oregon","washington","california")
west.states <- c("washington","montana", "idaho","utah","nevada","arizona","new mexico",
    "wyoming","colorado","south dakota","texas")
east.states <- c(setdiff(unique(all_states$state), union(weco.states,west.states)),
    "texas","south dakota")
all_states[,c("weco","west","east"):=FALSE]
all_states[state%in% weco.states, weco:=TRUE]
all_states[state%in% west.states, west:=TRUE]
all_states[state%in% east.states, east:=TRUE]


p.regbase <- ggplot() + coord_equal() +ylim(c(25,50))
p.weco <- p.regbase + geom_polygon(data=all_states[(weco),], aes(x=long, y=lat, group = group),colour="white", fill="grey" )
p.west <- p.regbase + geom_polygon(data=all_states[(west),], aes(x=long, y=lat, group = group),colour="white", fill="grey" )
p.east <- p.regbase + geom_polygon(data=all_states[(east),], aes(x=long, y=lat, group = group),colour="white", fill="grey" )

print(arrangeGrob(p.weco,p.west,p.east,ncol=3,nrow=1))
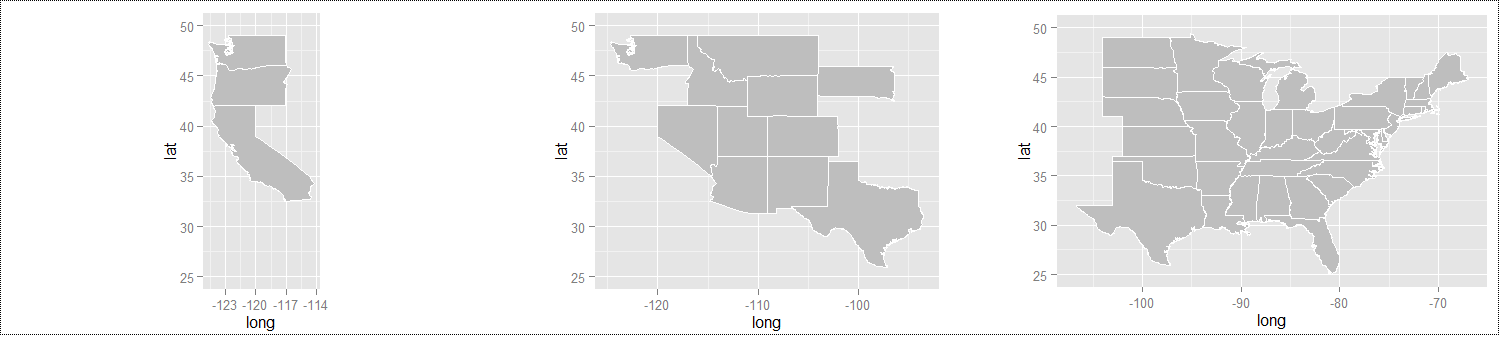
根据我在 Windows GUI 中调整图形窗口大小的方式,结果要么不好(比例不同)
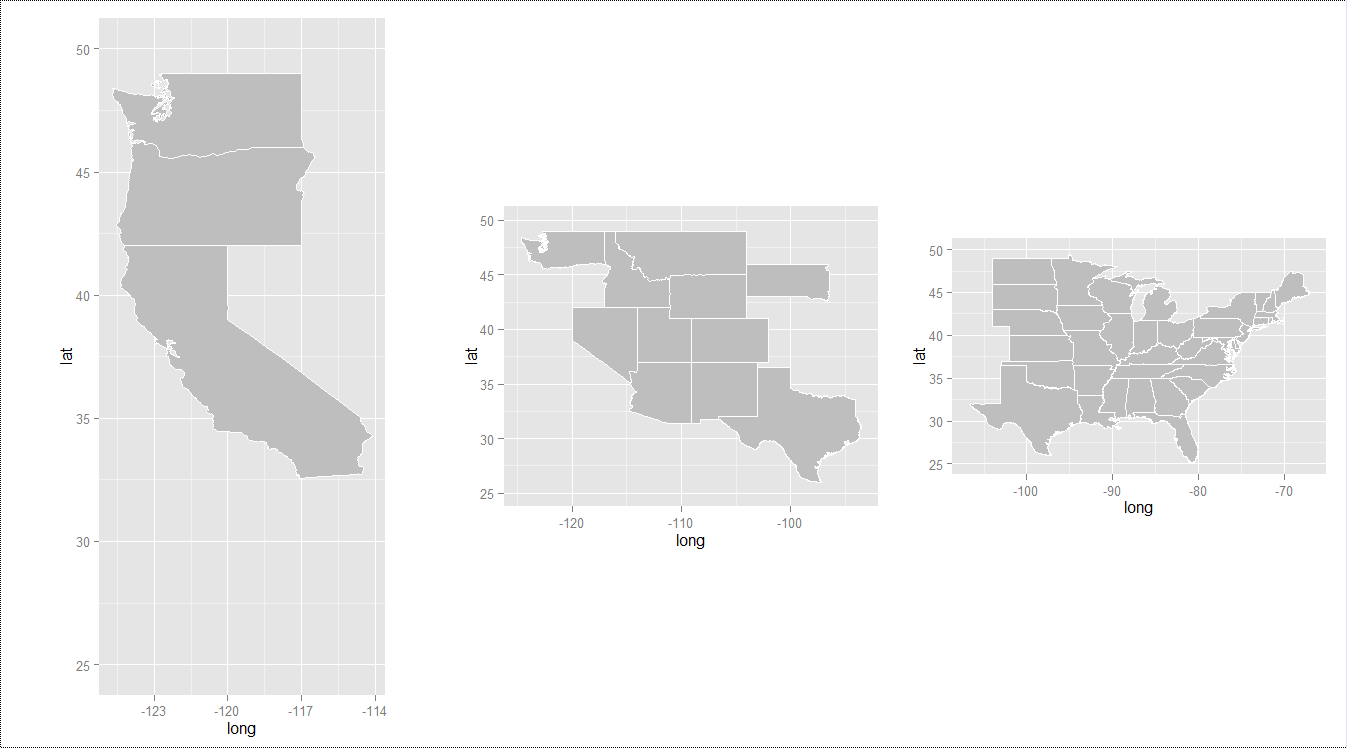
或体面(相同的高度)但空间太大:我怎样才能摆脱多余的空间?
最佳答案
让我们澄清一些事情。
grid.arrange不“添加填充”,它只是将 grobs 并排放置在网格布局中。您可以更改行中每个单元格的宽度,grid.newpage()
pushViewport(viewport(width=5, height=2.5, default.units="in"));
gt = grobTree(rectGrob(), circleGrob())
grid.arrange(gt, gt, gt, nrow=1, newpage=FALSE,
widths = unit(c(1, 2, 3), "null"))
upViewport()

g = ggplotGrob(p.weco)
g[["heights"]][3] # 2.37008405379269 is the aspect ratio for that plot panel
这些问题have been discussed here ;我不知道一个优雅和通用的解决方案。
关于r - 排列 ggplot 多个对象,同时保持高度不变,我们在Stack Overflow上找到一个类似的问题: https://stackoverflow.com/questions/17981434/