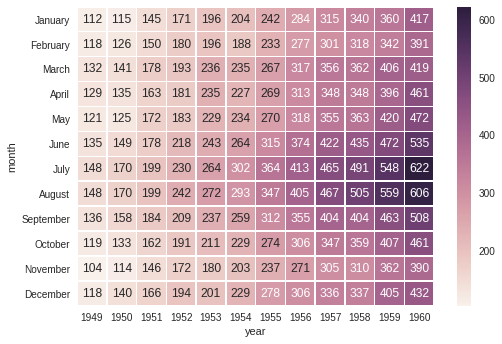
鉴于以下热图,我将如何删除轴标题(“月”和“年”)?
import seaborn as sns

# Load the example flights dataset and conver to long-form
flights_long = sns.load_dataset("flights")
flights = flights_long.pivot("month", "year", "passengers")

# Draw a heatmap with the numeric values in each cell
sns.heatmap(flights, annot=True, fmt="d", linewidths=.5)
最佳答案
调用前sns.heatmap ,使用 plt.subplots 获取轴,然后使用 set_xlabel和 set_ylabel .例如:
import seaborn as sns
import matplotlib.pyplot as plt

# Load the example flights dataset and conver to long-form
flights_long = sns.load_dataset("flights")
flights = flights_long.pivot("month", "year", "passengers")

# ADDED: Extract axes.
fig, ax = plt.subplots(1, 1, figsize = (15, 15), dpi=300)

# Draw a heatmap with the numeric values in each cell
sns.heatmap(flights, annot=True, fmt="d", linewidths=.5)

# ADDED: Remove labels.
ax.set_ylabel('')
ax.set_xlabel('')

关于python-3.x - 在 Seaborn 中隐藏轴标题,我们在Stack Overflow上找到一个类似的问题: https://stackoverflow.com/questions/34275140/