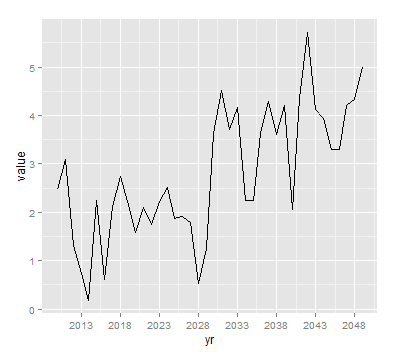
您好,我有 2010 年至 2050 年的年度数据。 我正在尝试制作线图,以便我的 x 轴从 2010 年开始并在 2050 年结束,显示 5 年间隔我 e 我希望 x 轴中断为(2010、2015、2020、....、2045、2050)。不幸的是,它从 2013 年开始,到 2048 年结束。为什么?如何解决这个问题? 我的数据、代码和结果图像如下。
plot1<- ggplot(test, aes(yr, y=value)) +
geom_line()+
scale_x_date(breaks = date_breaks("5 year"),labels=date_format("%Y")) +
scale_y_continuous(breaks=seq(-4,6, by=1))
plot1
数据
 dput(test)
structure(list(value = c(2.47099989218436, 3.09640452148661,
1.32121989082519, 0.742309399667898, 0.180070229458727, 2.2475619117108,
0.606470664265897, 2.12742331755353, 2.73894680327422, 2.22368873465667,
1.58381022102847, 2.10136510397371, 1.74582199030396, 2.21689521610787,
2.51618709804907, 1.87243814589322, 1.92029935267449, 1.79383249007138,
0.537680017904451, 1.2415782984683, 3.62075008273724, 4.50975793125965,
3.70660640492563, 4.16317150909305, 2.24008439109747, 2.24587596633027,
3.63019754286973, 4.28513572439197, 3.61013179034863, 4.20010027834161,
2.06766292535187, 4.34833637648799, 5.71460894423653, 4.12185659615561,
3.93305702163007, 3.29384139246081, 3.2915580598453, 4.21009646693621,
4.32889796119913, 4.99213117815761), yr = structure(c(14610,
14975, 15340, 15706, 16071, 16436, 16801, 17167, 17532, 17897,
18262, 18628, 18993, 19358, 19723, 20089, 20454, 20819, 21184,
21550, 21915, 22280, 22645, 23011, 23376, 23741, 24106, 24472,
24837, 25202, 25567, 25933, 26298, 26663, 27028, 27394, 27759,
28124, 28489, 28855), class = "Date")), .Names = c("value", "yr"
), class = "data.frame", row.names = c(NA, 40L))
最佳答案
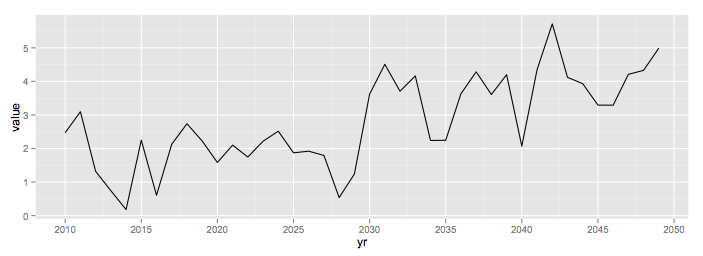
如果你确切地知道你想要的中断值在哪里,那么只需告诉ggplot
plot1<- ggplot(test, aes(yr, y=value)) +
geom_line()+
scale_x_date(breaks = seq(as.Date("2010-01-01"), as.Date("2050-12-31"), by="5 years"),
    labels=date_format("%Y")) +
scale_y_continuous(breaks=seq(-4,6, by=1))
关于r - 在ggplot2中创建特定的日期范围(scale_x_date),我们在Stack Overflow上找到一个类似的问题: https://stackoverflow.com/questions/26458822/