我正在尝试绘制一个巨大的相关系数矩阵,目前,我的图如下所示:
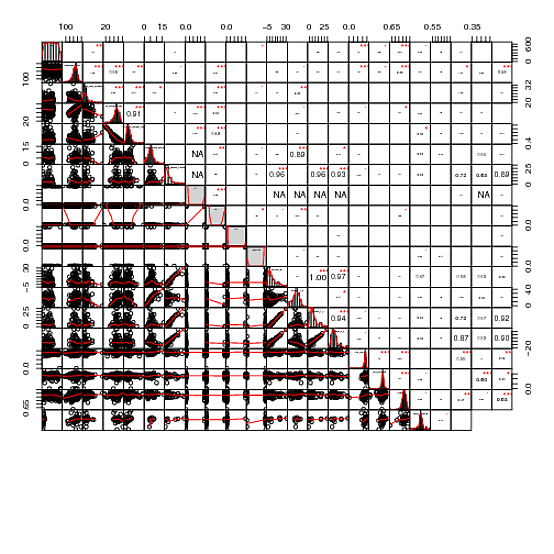
请注意,某些单元格缺少相关系数(暂时忽略绘图缺乏对称性,除非您也恰好知道为什么会出现这种情况)。我相信这些值实际上并没有缺失,只是太小而无法出现,因为它们是按相关系数值缩放的。
查看 Chart.Correlation() 的文档,我找到了一个函数,chart.Correlation() 的大部分内容都是根据该函数建模的:
panel.cor <- function(x, y, digits=2, prefix="", cex.cor)
{
    usr <- par("usr"); on.exit(par(usr))
    par(usr = c(0, 1, 0, 1))
    r <- abs(cor(x, y))
    txt <- format(c(r, 0.123456789), digits=digits)[1]
    txt <- paste(prefix, txt, sep="")
    if(missing(cex.cor)) cex <- 0.8/strwidth(txt)
    test <- cor.test(x,y)
    # borrowed from printCoefmat
    Signif <- symnum(test$p.value, corr = FALSE, na = FALSE,
                  cutpoints = c(0, 0.001, 0.01, 0.05, 0.1, 1),
                  symbols = c("***", "**", "*", ".", " "))

    text(0.5, 0.5, txt, cex = cex * r)
    text(.8, .8, Signif, cex=cex, col=2)
}
pairs(USJudgeRatings[,c(2:3,6,1,7)], lower.panel=panel.smooth, upper.panel=panel.cor)
如果我改变:
text(0.5, 0.5, txt, cex = cex * r)
致:
text(0.5, 0.5, txt, cex = 0.8)
我大致得到了我想要的效果。问题是我不知道如何使用 Chart.Correlation() 本身更改此参数。这个问题有意义吗?
最佳答案
这里有一个修改函数以允许您想要的功能的技巧。这会向函数添加一个用户可设置的指数参数,允许您将 cex 值更改为 cex*[correlation]^cex.cor.scale。
由于 ... 的处理方式,它会发出警告;它们很烦人但无害。
最好联系维护者并询问他们是否愿意增强该功能,或者开始创建您自己的软件包的修改版本。
编辑:对相关行进行稍微更稳健的更改
library("PerformanceAnalytics")
## turn the function into a character string
tmpstr <- deparse(chart.Correlation)
## modify the relevant lines
panelcorline <- grep("^ *panel.cor",tmpstr)
tmpstr[panelcorline] <- paste(tmpstr[panelcorline],"cex.cor.scale=1,")
rscaleline <- grep("^ *text\\(0.5",tmpstr)
tmpstr[rscaleline] <- gsub("cex \\* r","cex*r^cex.cor.scale",tmpstr[rscaleline])
## convert back to a function (don't mask the original function)
my.chart.Correlation <- eval(parse(text=tmpstr))
测试一下:
data(managers)
chart.Correlation(managers[,1:8], histogram=TRUE, pch="+")
## no scaling
my.chart.Correlation(managers[,1:8], histogram=TRUE, pch="+",cex.cor.scale=0)
## enhanced scaling
my.chart.Correlation(managers[,1:8], histogram=TRUE, pch="+",cex.cor.scale=2)
关于r - 防止cex与chart.Correlation()中的相关系数进行缩放,我们在Stack Overflow上找到一个类似的问题: https://stackoverflow.com/questions/12925213/