我正在使用下面的代码来学习 Shiny R ,当我运行此代码时,它给了我这个错误:
Warning: Error in hist.default: 'x' must be numeric [No stack trace available]
library(shiny)

ui <- fluidPage(
  selectInput("Ind","Indipendent Variable",choices = names(mtcars)),
  selectInput('Dep','  Dependent Variable',choices = names(mtcars)),
  plotOutput("BoxPlot"),
  plotOutput('Hist'))

server <- function(input, output, session) {

  data1 <- reactive({input$Ind})
  data2 <- reactive({input$Dep})

  output$BoxPlot <- renderPlot({boxplot(get(data2()) ~ get(data1()) , data=mtcars)})

  output$Hist <- renderPlot({hist(get(data1())})

}

shinyApp(ui, server)
任何帮助为什么会这么说?
最佳答案
尽量不要将所有内容都放入一行,因为这不会提高可读性,您可以使用 Google's R Style Guide如果您愿意。要回答您的问题,您可以通过 [[]] 访问变量,如下所示:
library(shiny)
ui <- fluidPage(
selectInput("Ind","Indipendent Variable",choices = names(mtcars)),
selectInput('Dep',' Dependent Variable',choices = names(mtcars)),
plotOutput("BoxPlot"),
plotOutput('Hist')
)
server <- function(input, output, session) {
data1 <- reactive({
input$Ind
})
data2 <- reactive({
input$Dep
})
output$BoxPlot <- renderPlot({
boxplot(get(data2()) ~ get(data1()) , data=mtcars)
})
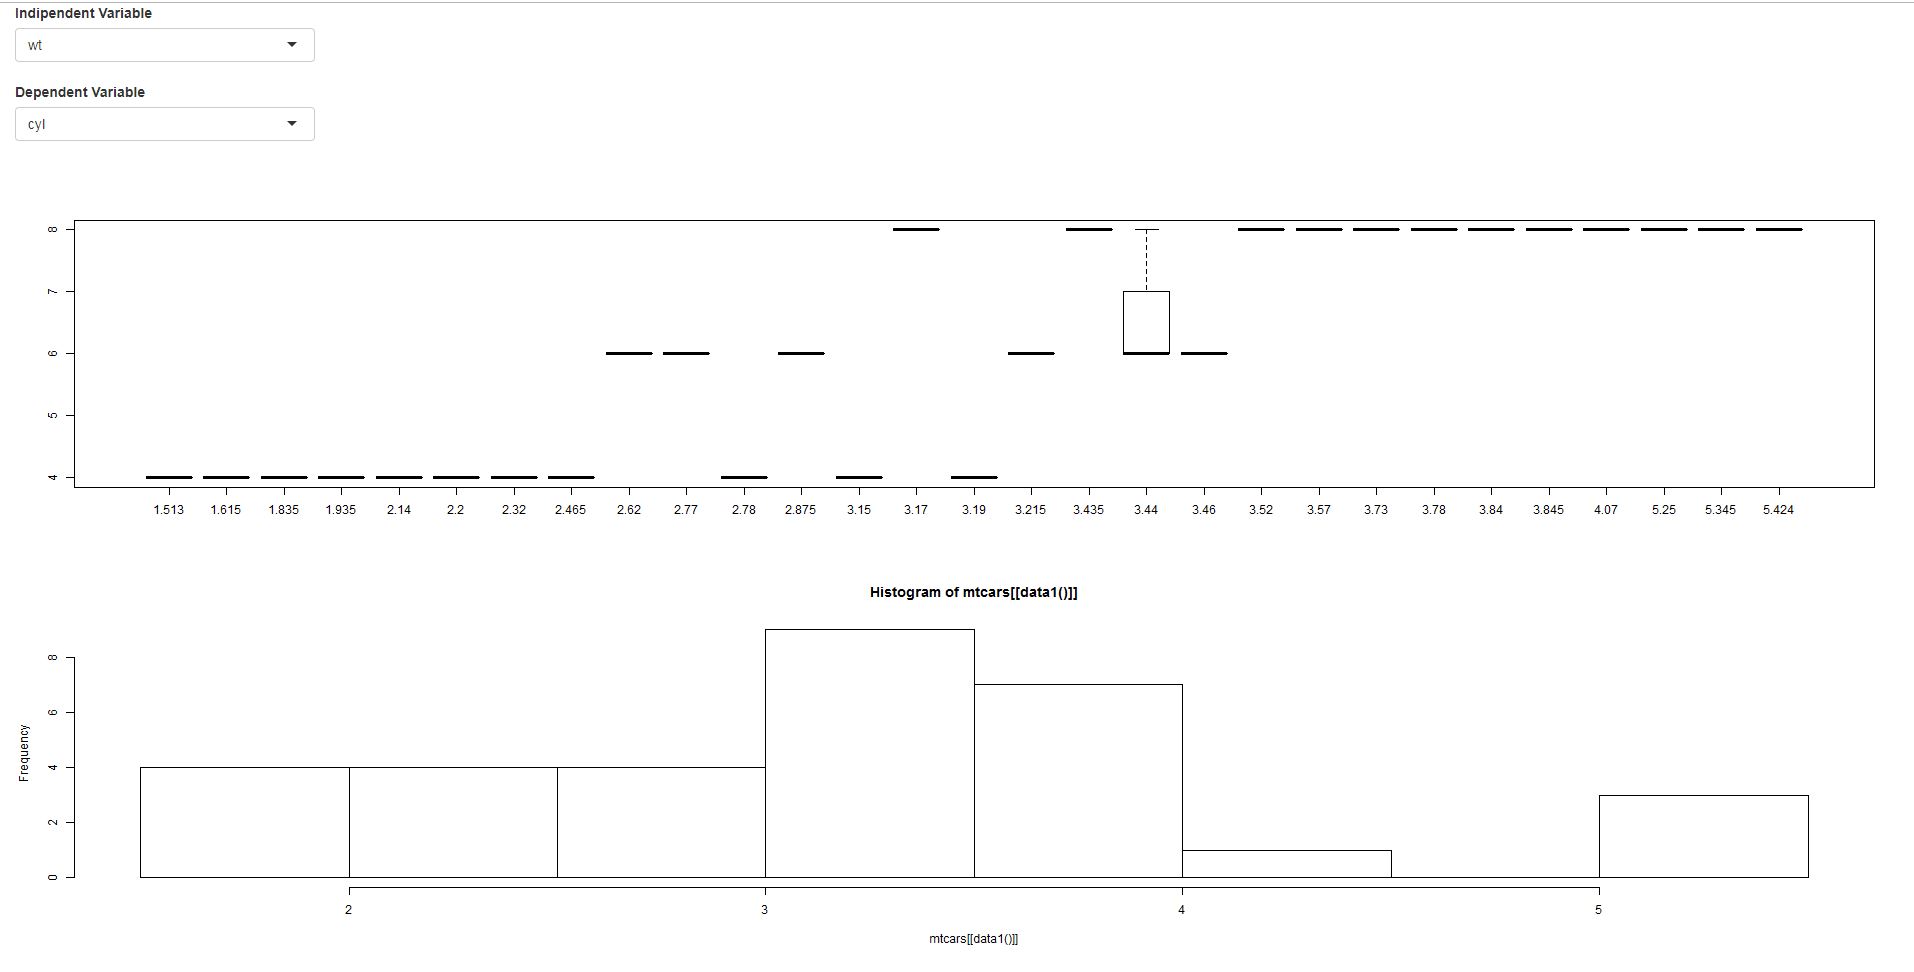
output$Hist <- renderPlot({
req(data1())
hist(mtcars[[data1()]])
})
}
shinyApp(ui, server)
关于r - Shiny 的 R 直方图,我们在Stack Overflow上找到一个类似的问题: https://stackoverflow.com/questions/52611963/