我有这个数据框:
> str(DF)
'data.frame':   14084 obs. of  6 variables:
.
.
.
 $ Variables: chr  "Height" "Height" "Height" "Height" ...
 $ Values   : num  245 129 301 162 123 125 115 47 46 135 ...
 $ Year     : Factor w/ 2 levels "2015","2016": 1 1 1 1 1 1 1 1 1 1 ...
我使用带有自由轴刻度的facet_wrap()将绘图包裹在两个方面(两列)中。
ggplot(data = DF, aes(x = Year, y = Values)) +
  geom_boxplot() +
  facet_wrap("Variables", scales = "free")
我的问题是:
这两个方面共享一个共同的 y 轴标题。 但是,我想要的是两个方面的两个单独的 y 轴标题。通用的 x 轴标题对我来说就很好。
我遇到了这个问题Showing different axis labels using ggplot2 with facet_wrap 但它并没有按照我想要的方式解决问题,因为我不想丢失顶部的刻面标签。而且,我的面是水平排列的。
我尝试使用labs():
. . . +
labs(y=c("A", "B"))
但它只是将第一个面的 y 轴标题更改为 A,第二个面保持原样。
我该如何解决这个问题?
如有任何帮助,我们将不胜感激。
最佳答案
不确定我是否完全理解您的需要,但这是我基于 your suggested link 的尝试和 this one .
library(ggplot2)
library(grid)
library(gtable)
# Some fake data
set.seed(2018)
df <- data.frame(variables = rep(c("var1", "var2"), times = 100),
values = rnorm(100),
year = as.factor(2001:2010))
# Make a plot with positioning the strip labels to the right of each facet,
# acting as OY axis titles.
# We will add the top strip labels in the next step,
# using the `grid` & `gtable` packages functionality.
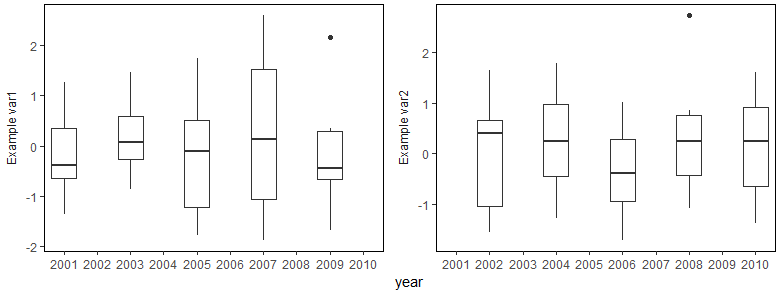
p <- ggplot(df, aes(x = year, y = values, group = year) ) +
geom_boxplot() +
facet_wrap(~ variables, scales = "free_y", nrow = 1,
strip.position = "left",
labeller = as_labeller(c(var1 = "Example var1",
var2 = "Example var2") ) ) +
ylab(NULL) +
theme(strip.background = element_blank(),
strip.placement = "outside",
# Customize theme so that is black & white style as requested
panel.background = element_rect(fill = NA, colour = 'black'),
panel.grid = element_blank())
p
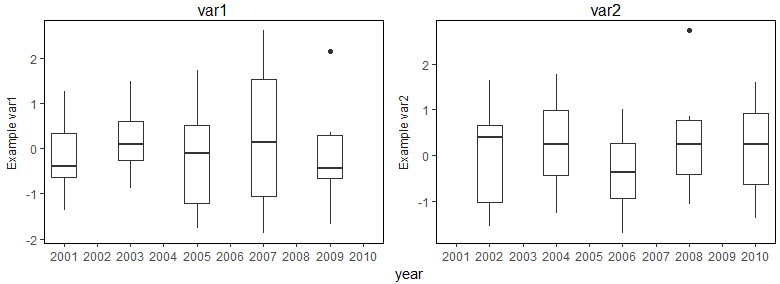
使用grid和gtable包的功能添加顶部 strip 标签:
# Get gtable object
g <- ggplotGrob(p)
# Sometimes helpful to get an idea about the grobs' position
grid.show.layout(gtable:::gtable_layout(g))

# Add an extra top row (make some space)
g <- gtable_add_rows(x = g, heights = unit(0.65, 'cm'), pos = 2)
# First strip
g <- gtable_add_grob(x = g,
                     grobs = list(rectGrob(gp = gpar(col = NA,
                                                     fill = NA)),
                                  textGrob(label = "var1",
                                           gp = gpar(col = "black"))),
                     t = 3, l = 7, b = 3, r = 7,
                     name = c("strip-top-1-rectg", "strip-top-1-text"))
# Second strip
g <- gtable_add_grob(x = g,
                     grobs = list(rectGrob(gp = gpar(col = NA,
                                                     fill = NA)),
                                  textGrob(label = "var2",
                                           gp = gpar(col = "black"))),
                     t = 3, l = 13, b = 3, r = 13,
                     name = c("strip-top-2-rectg", "strip-top-2-text"))

# Draw the edited plot
grid.newpage()
grid.draw(g)
关于r - 绘图的两个方面的两个单独的 y 轴标题,同时使用 ggplot2 保留方面顶部 strip 标签,我们在Stack Overflow上找到一个类似的问题: https://stackoverflow.com/questions/53745875/