我正在尝试在 NVD3 中生成带有垂直线的折线图。特别是this kind折线图。
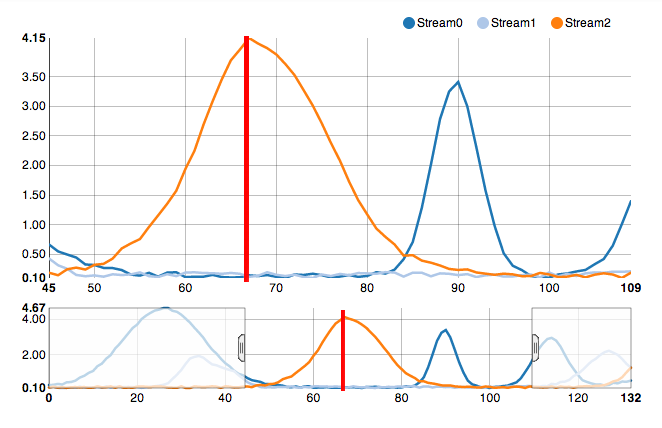
折线图有两个面板,一个查看面板和一个缩放面板,我希望线条位于两个面板上。
类似这样的事情:
这可行吗?
编辑: 我找到了一种方法,只需向数据附加一个表示一行的额外流即可。例如
streams[3] = {key:'myline', values:[{x:68,y:0},{x:68,y:7}]}
有更好的方法吗?
最佳答案
是的,这是可能的,
以下是如何执行此操作的示例: https://gist.github.com/timelyportfolio/80d85f78a5a975fa29d7#file-code-r
这里的解决方案是添加一个使用 NVD3 绘制垂直线的 javascript 函数(仔细阅读注释):
function drawVerticalLines(opts) {

  // CAREFUL HERE !!! the css pasth ".nvd3 .nv-focus .nv-linesWrap" depends on the type of chart you are using, lineChart would use only ".nvd3 .nv-linesWrap" ... !
  if (!(d3.select('#' + opts.id + ' the css pasth ".nvd3 .nv-focus .nv" depends on the type of chart you are using, lineChart would use only -linesWrap').select('.vertical-lines')[0][0])) {
    // Adds new g element with .vertical-lines class; use a css debugger to verify
    d3.select('#' + opts.id + ' .nvd3 .nv-focus .nv-linesWrap').append('g')
      .attr('class', 'vertical-lines')
  }

  vertLines = d3.select('#' + opts.id + ' .nvd3 .nv-focus .nv-linesWrap').select('.vertical-lines').selectAll('.vertical-line')
    .data(
      [{
        'date': new Date('1967-11-30'),
        'label': 'something to highlight 1967'
      }, {
        'date': new Date('2001-11-30'),
        'label': 'something to highlight 2001'
      }])

  var vertG = vertLines.enter()
    .append('g')
    .attr('class', 'vertical-line')

  vertG.append('svg:line')
  vertG.append('text')

  vertLines.exit().remove()

  // CAREFUL 2 : chart.xAxis.scale() scale depends how you are defining your x Axis in nvd3 chart ... if your are using timestamps, (d.date / 60 / 60 / 24 / 1000) becomes (d.date)

  vertLines.selectAll('line')
    .attr('x1', function(d) {
      return chart.xAxis.scale()(d.date / 60 / 60 / 24 / 1000)
    })
    .attr('x2', function(d) {
      return chart.xAxis.scale()(d.date / 60 / 60 / 24 / 1000)
    })
    .attr('y1', chart.yAxis.scale().range()[0])
    .attr('y2', chart.yAxis.scale().range()[1])
    .style('stroke', 'red')

  vertLines.selectAll('text')
    .text(function(d) {
      return d.label
    })
    .attr('dy', '1em')
    //x placement ; change dy above for minor adjustments but mainly
    //    change the d.date/60/60/24/1000
    //y placement ; change 2 to where you want vertical placement
    //rotate -90 but feel free to change to what you would like
    .attr('transform', function(d) {
      return 'translate(' +
        chart.xAxis.scale()(d.date / 60 / 60 / 24 / 1000) +
        ',' +
        chart.yAxis.scale()(2) +
        ') rotate(-90)'
    })
    //also you can style however you would like
    //here is an example changing the font size
    .style('font-size', '80%')

}
并在nv.addGraph回调中调用该方法:
var sharedChart = null; // Shared reference on the chart

nv.addGraph(function() {
      .....

      sharedChart = chart;

      return chart;

      ,
      function() {
        drawVerticalLines(opts, sharedChart);
      }
    );
使用 opts ...(显然你并不真正需要它):
var opts${widgetID.replace('-', '0')} = {
         "dom": "chart${widgetID}",
         "width":    800,
         "height":    400,
         "x": "date",
         "y": "value",
         "group": "variable",
         "type": "lineWithFocusChart",
         "id": "chart${widgetID}"
     };
希望这有帮助,我花了很长时间才找到它并使其工作!
关于svg - 带垂直线的 NVD3 折线图,我们在Stack Overflow上找到一个类似的问题: https://stackoverflow.com/questions/19582005/