我有两个文件,我将使用以下代码绘制一条点线:
set terminal postscript eps color solid font "Helvetica, 22"
set size ratio 0.625
set output "example.eps"

set key right top

plot "traffic.txt" using 1:2 title "traffic" with lp pt 7 ps 1 lc rgb "red", \
 "solar.txt" using 1:($2*100) title "solar" with lp pt 9 ps 1 lc rgb "blue"
任何一条线都与 x 轴一起形成一个区域,并且两条线形成的区域重叠。我想知道如何对重叠部分进行着色。
谢谢!
(使用的文件如下)
文件1
1   66.660000
2   47.830000
3   39.270000
4   27.940000
5   24.990000
6   27.930000
7   32.060000
8   43.650000
9   70.470000
10   73.430000
11   87.690000
12   111.790000
13   122.170000
14   114.930000
15   111.620000
16   109.330000
17   121.370000
18   118.600000
19   132.890000
20   132.480000
21   148.360000
22   152.260000
23   140.510000
24   99.120000
文件2
1   0
2   0
3   0
4   0
5   0
6   0
7   0
8   0
9   0.121933
10  1.81455
11  2.25622
12  2.67994
13  2.87834
14  2.53149
15  1.29541
16  0.57571
17  0.0883007
18  0
19  0
20  0
21  0
22  0
23  0
24  0
最佳答案
您可以使用filledcurves绘图样式。为此,所有数据必须包含在一个文件中。您可以即时合并文件,例如使用粘贴。对于使用 python 的独立于平台的解决方案,请查看例如this answer .
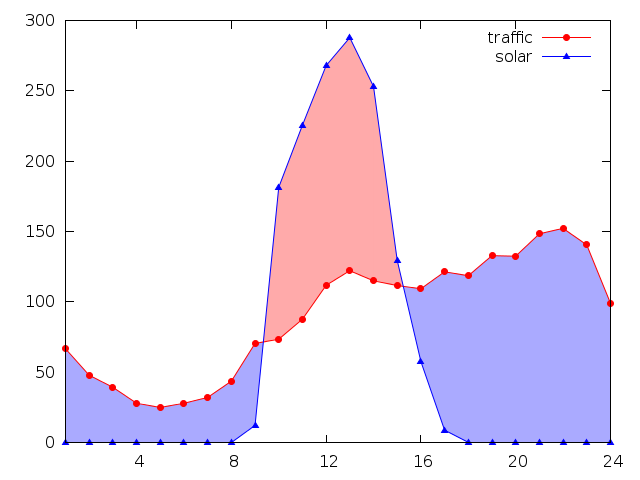
使用filledcurves,您还可以区分above和below以便使用不同的颜色:
set key right top
set autoscale xfix
set xtics 4
plot "< paste traffic.txt solar.txt" using 1:2:($4*100) with filledcurves below lc rgb "#ffaaaa" t '', \
     "" using 1:2:($4*100) with filledcurves above lc rgb "#aaaaff" t '',\
     "traffic.txt" using 1:2 title "traffic" with lp pt 7 ps 1 lc rgb "red", \
     "solar.txt" using 1:($2*100) title "solar" with lp pt 9 ps 1 lc rgb "blue"
4.6.4的结果是:
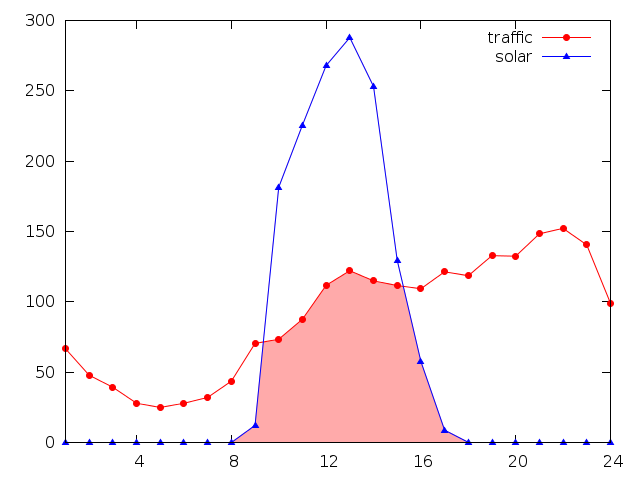
要仅对两条曲线重叠的区域进行着色,您需要一个解决方法。首先对较窄曲线和 x1 轴之间的区域进行着色,然后用白色覆盖该阴影的部分:
set autoscale xfix
set xtics 4
plot "< paste traffic.txt solar.txt" using 1:($4*100) with filledcurves x1 lc rgb "#ffaaaa" t '', \
     "" using 1:2:($4*100) with filledcurves below lc rgb "white" t '',\
     "traffic.txt" using 1:2 title "traffic" with lp pt 7 ps 1 lc rgb "red", \
     "solar.txt" using 1:($2*100) title "solar" with lp pt 9 ps 1 lc rgb "blue"
这给出:
关于gnuplot - 线之间有阴影区域的绘图,我们在Stack Overflow上找到一个类似的问题: https://stackoverflow.com/questions/19873467/