使用 Jupyter 4.4.0 和 Python 3.6.5 (Anaconda),我生成如下热图:
import seaborn as sns
import numpy as np
import pandas as pd
import matplotlib
import matplotlib.pyplot as plt

# generate a 9x4 matrix of random values and long labels
x,y = 9,4
plt.figure(figsize=(x,y))
scores = np.random.random((y, x))
cols = ['looooooooooong_label_x_%d' % i for i in range(x)]
rows = ['looooooooooong_label_y_%d' % i for i in reversed(range(y))]

# generate a heatmap using seaborn with rotated labels
ax = sns.heatmap(pd.DataFrame(scores, columns=cols, index=rows), annot=True, square=True, cbar=False,  cmap='YlGnBu', xticklabels=True, yticklabels=True)
ax.set_yticklabels(ax.get_yticklabels(), rotation=0, fontsize=8)
ax.set_xticklabels(ax.get_xticklabels(), rotation=45, fontsize=8, rotation_mode='anchor', ha='right')
在笔记本中,Jupyter 自动渲染此图像,如下所示:
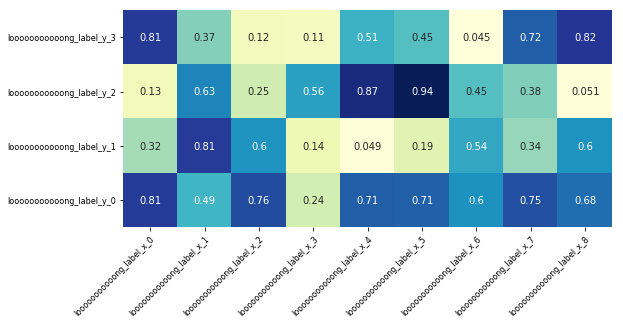
这看起来正是我想要的。但是,当我采取下一步并将绘图保存到文件时:
ax.figure.savefig('hmx.png')
此文件显示为:
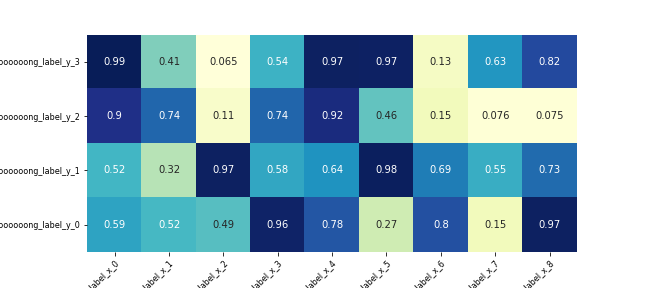
差异似乎是:
- 保存的图像似乎向下和向左移动,切断了标签;
- Jupyter 渲染的 PNG 具有透明背景,而保存的图像则没有(它具有白色背景)。
我想知道如何将 Jupyter 生成的图像保存到文件中,或者更好的是,当我尝试自己保存 PNG 时我做错了什么。
最佳答案
已修复!
ax.figure.savefig('hmx.png', transparent=True, bbox_inches='tight')
输出现在与 Jupyter 生成的内容匹配:透明且正确对齐,没有任何标签被切断:

关于python - matplotlib 和 seaborn 热图在 Jupyter 中与 savefig 的渲染方式不同(标签被切断),我们在Stack Overflow上找到一个类似的问题: https://stackoverflow.com/questions/51568083/