绘制世界地图时,ggplot2 存在问题:它用相同的颜色对整个背景进行着色,包括实际上不属于地球一部分的绘图的角点,请参阅快照下面由以下代码生成(它使用前沿 sf abd ggplot2 版本,但问题是通用的,请参阅下面提到的博客文章):
    #install.packages("devtools")
    #devtools::install_github("tidyverse/ggplot2")
    #devtools::install_github("edzer/sfr")

    library(ggplot2)
    library(sf)
    library(rnaturalearth)
    library(dplyr)

    theme_map <- function(...) {
      theme_minimal() +
      theme(
        text = element_text(family = "Ubuntu Regular", color = "#22211d"),
        axis.line = element_blank(),
        axis.text.x = element_blank(),
        axis.text.y = element_blank(),
        axis.ticks = element_blank(),
        axis.title.x = element_blank(),
        axis.title.y = element_blank(),
        panel.grid.minor = element_line(color = "#ebebe5", size = 0.2),
        panel.grid.major = element_line(color = "#ebebe5", size = 0.2),
        plot.background = element_rect(fill = "#f5f5f2", color = NA),
        panel.background = element_rect(fill = "#f5f5f2", color = NA),
        legend.background = element_rect(fill = "#f5f5f2", color = NA),
        panel.border = element_blank(),
        ...
      )
    }

    crs <- "+proj=laea +lat_0=52 +lon_0=10 +x_0=4321000 +y_0=3210000 +datum=WGS84 +units=m +no_defs"
    ctrys50m <- ne_countries(scale = 50, type = "countries", returnclass = "sf") %>%
       select(iso_a3, iso_n3, admin)

    ggplot() +
      geom_sf(data = ctrys50m, alpha = 0.15, fill="grey") +
      coord_map() +
      coord_sf(crs = crs) +
      theme_map()

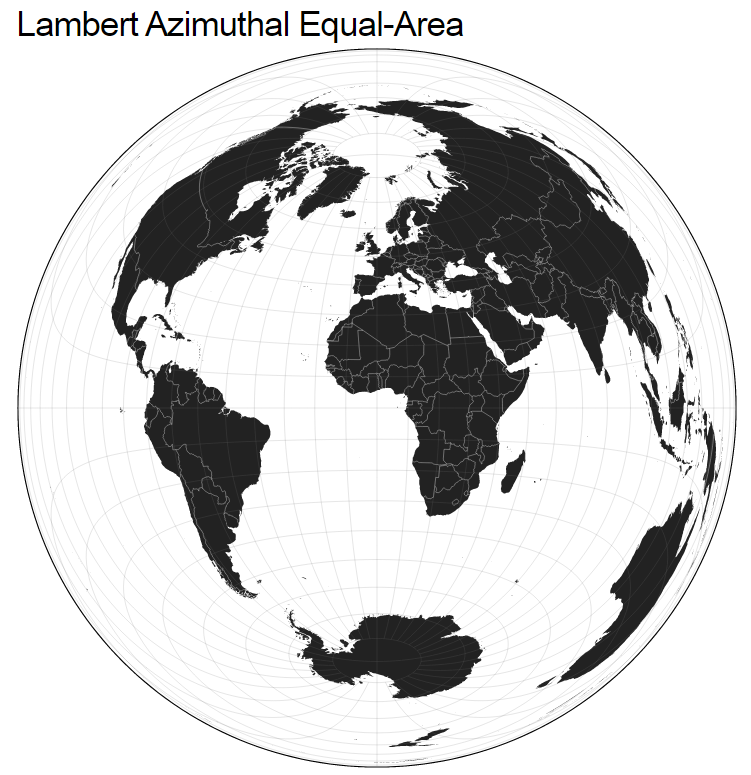
为了能够很好地绘制地球轮廓,在D3.js中使用了特殊的GeoJSON type,{type: "Sphere"}已添加,参见this thread可以在行动中看到 here :如下快照中的外部整个地球黑色边框:
我在 R/ggplot2 中发现的唯一技巧是 Matt Strimas-Mackey 在他的博客文章 Mapping the Longest Commericial Flights in R 中发布的技巧。 ,参见Bounding box and graticules部分以及 make_bbox 和 project_recenter 函数。
这些代码相当多,我想知道是否有一些
sf 或 geom_sf 代码会生成更干净/更简单的代码,所以我尝试了:
    # whole world WSG84 bounding box
    sphere <- ne_download(category = "physical", type = "wgs84_bounding_box", returnclass = "sf")
    sphere_laea <- st_transform(sphere, crs)
    ggplot() +
      geom_sf(data = sphere, fill = "#D8F4FF") +
      coord_sf(crs = crs) +
      geom_sf(data = ctrys50m, alpha = 0.15, fill="grey") +
      coord_map() +
      coord_sf(crs = crs) +
      theme_map()
我得到的只是一个额外的“反子午线”(注意来自北极的线...),并且没有海洋充满#D8F4FF...
而且多边形的底部非常不规则(D3.js 大师做了一些聪明的 adaptive resampling 来提高投影线的准确性......)
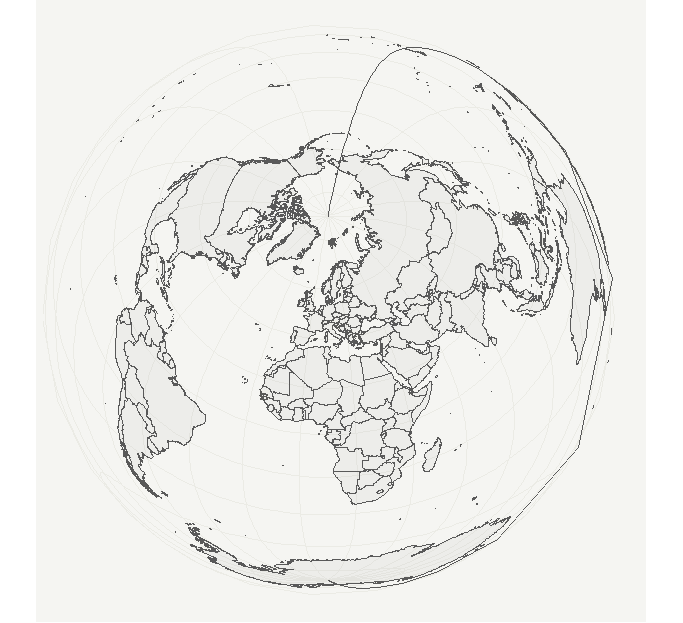
关于我尝试为 ggplot2 世界地图获取整个世界多边形的过程有什么问题吗? (感谢您阅读本文!)
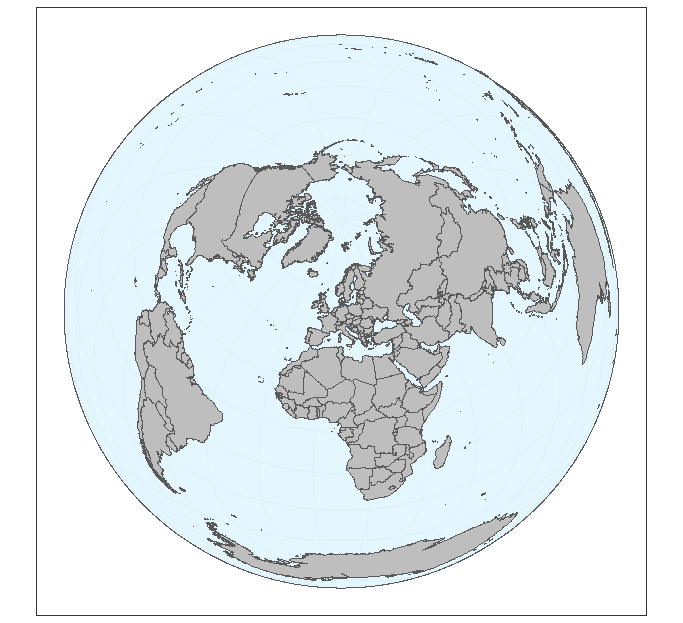
最佳答案
按照 Dave 的建议,我创建了一个足够小的新经纬网,以便凸包操作能够产生足够好的近似地球边界的结果。 以下代码给出了非常好的结果(见后图):
library(ggplot2)
library(sf)
library(rnaturalearth)
library(dplyr)

crs <- "+proj=laea +lat_0=52 +lon_0=10 +x_0=4321000 +y_0=3210000 +datum=WGS84 +units=m +no_defs"

ctrys50m <- ne_countries(scale = 50, type = "countries", returnclass = "sf") %>%
  select(iso_a3, iso_n3, admin)

sphere <- st_graticule(ndiscr = 10000, margin = 10e-6) %>%
  st_transform(crs = crs) %>%
  st_convex_hull() %>%
  summarise(geometry = st_union(geometry))

ggplot()  +
  geom_sf(data = sphere, fill = "#D8F4FF", alpha = 0.7) +
  geom_sf(data = ctrys50m, fill="grey") +
  theme_bw()
关于r - ggplot2(和 sf)中世界地图的整个地球多边形,我们在Stack Overflow上找到一个类似的问题: https://stackoverflow.com/questions/43207947/