我尝试将时间线/x 轴与绘制的图表同步,但它无法正常工作。有人知道为什么 x 轴比绘图运行得更快吗?
<!DOCTYPE html>
<html>
    <head>
        <meta charset="utf-8">

        <style>
        body {
            font-family: "Helvetica Neue", Helvetica, Arial, sans-serif;
        }

        .graph .axis {
            stroke-width: 1;
        }

        .graph .axis .tick line {
            stroke: black;
        }

        .graph .axis .tick text {
            fill: black;
            font-size: 0.7em;
        }

        .graph .axis .domain {
            fill: none;
            stroke: black;
        }

        .graph .group {
            fill: none;
            stroke: black;
            stroke-width: 1.5;
        }
        </style>
    </head>
    <body>
        <div class="graph"></div>

        <script src="http://d3js.org/d3.v3.min.js"></script>
        <script>
        var limit = 200,
            duration = 300,
            now = new Date(Date.now() - duration)

        var width = 500,
            height = 350

        var groups = {
            current: {
                value: 0,
                color: 'orange',
                data: d3.range(limit).map(function() {
                    return 0
                })
            },
            target: {
                value: 0,
                color: 'green',
                data: d3.range(limit).map(function() {
                    return 0
                })
            },
            output: {
                value: 0,
                color: 'grey',
                data: d3.range(limit).map(function() {
                    return 0
                })
            }
        }

        var x = d3.time.scale()
            .domain([now - (limit - 2), now - duration])
            .range([0, width])

        var y = d3.scale.linear()
            .domain([0, 100])
            .range([height, 0])

        var line = d3.svg.line()
            .interpolate('basis')
            .x(function(d, i) {
                return x(now - (limit - 1 - i) * duration)
            })
            .y(function(d) {
                return y(d)
            })

        // Container
        var svg = d3.select('.graph').append('svg')
            .attr('class', 'chart')
            .attr('width', width)
            .attr('height', height + 50)

        // Bottom Axis
        var axis = svg.append('g')
            .attr('class', 'x axis')
            .attr('transform', 'translate(0,' + height + ')')
            .call(x.axis = d3.svg.axis().scale(x).orient('bottom'))

        var paths = svg.append('g')

        // Painting
        for (var name in groups) {
            var group = groups[name]
            group.path = paths.append('path')
                .data([group.data])
                .attr('class', name + ' group')
                .style('stroke', group.color)
        }

        // Concrete Action
        function tick() {
        now = new Date()

            // Add new values
            for (var name in groups) {
                var group = groups[name]
                //group.data.push(group.value) // Real values arrive at irregular intervals
                group.data.push(Math.random() * 100)
                group.path.attr('d', line)
            }

            // Shift domain
            x.domain([now - (limit - 2) * duration, now - duration])

            // Slide x-axis left
            axis.transition()
                .duration(duration)
                .ease('linear')
                .call(x.axis)

            // Slide paths left
            paths.attr('transform', null)
                .transition()
                .duration(duration)
                .ease('linear')
                .attr('transform', 'translate(' + x(now - (limit - 1) * duration) + ')')
                .each('end', tick)

            // Remove oldest data point from each group
            for (var name in groups) {
                var group = groups[name]
                group.data.shift()
            }
        }

        tick()
        </script>
    </body>
</html>
开始示例:
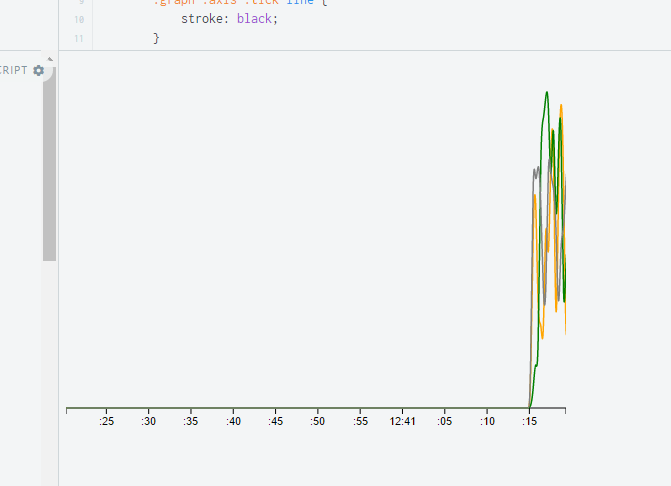
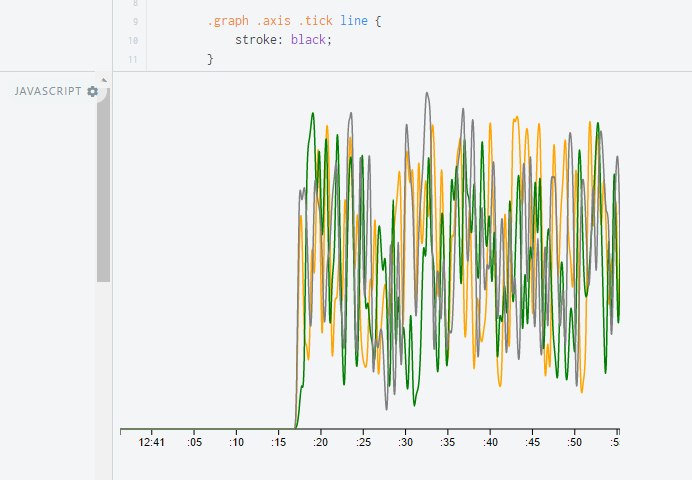
查看几秒后移动示例:
它从 :15 开始,逐渐向 :20 移动
感谢您的帮助!
最佳答案
由于您希望轴每秒移动一次并显示每 5 秒的标签,因此您可以使用 .ticks(d3.time.second, 5) 调整轴移动的速度,如下所示:
 var axis = svg.append('g')
        .attr('class', 'x axis')
        .attr('transform', 'translate(0,' + height + ')')
        .call(x.axis =        d3.svg.axis().scale(x).orient('bottom').ticks(d3.time.second, 5))
https://jsfiddle.net/mkaran/ejcnadp1/
希望这有帮助! 祝你好运。
关于javascript - x 轴和绘图不同步,我们在Stack Overflow上找到一个类似的问题: https://stackoverflow.com/questions/41057887/