我正在尝试制作这样的图表:
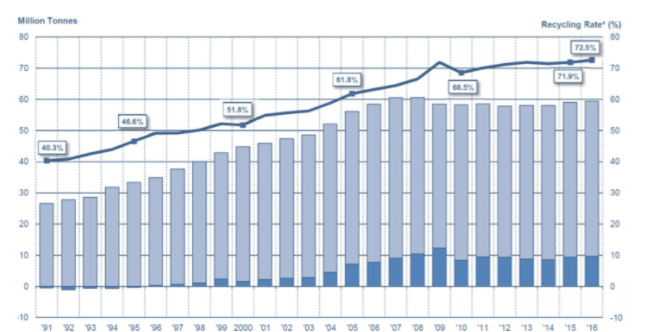
如您所见,它有一个辅助 Y 轴以及 x 和 y 方向的绘图线。我已经成功实现了以下目标(请参阅下面的代码),但我正在努力处理辅助 y 轴和垂直绘图线。如何添加辅助 y 轴和垂直绘图线?预先感谢您的帮助或任何指导。
//Graficas latest
Highcharts.chart('grafica1', {
  chart: {
    events: {
      load: function() {
        var label = this.renderer.label("SOURCE: CEPI")
          .css({
            width: '600px',
            fontSize: '1em',
            color: '#414042'
          })
          .attr({
            'stroke': 'silver',
            'stroke-width': 0,
            'r': 2,
            'padding': -15
          })
          .add();
        label.align(Highcharts.extend(label.getBBox(), {
          align: 'center',
          x: 30, // offset
          verticalAlign: 'bottom',
          y: 0 // offset
        }), null, 'spacingBox');
      }
    },
    marginBottom: 90
  },
  title: {
    text: 'European Recycling Rate of Paper for Recycling',
    style: {
      fontSize: '2.5em'
    }
  },
  subtitle: {
    text: 'CEPI Statistics - Status as of 2015'
  },
  xAxis: {
    categories: ['1991', '1992', '1993', '1994', '1995', '1996', '1997', '1998', '1999', '2000', '2001', '2002', '2003', '2004', '2005', '2006', '2007', '2008', '2009', '2010', '2011', '2012', '2013', '2014', '2015']
  },
  yAxis: {
    title: {
      text: ''
    }
  },
  series: [{
    type: 'column',
    color: '#8cc640',
    name: 'Paper & Board Consumption',
    data: [64.801, 65.576, 65.863, 70.939, 70.937, 71.124, 76.629, 79.788, 82.228, 86.826, 83.878, 84.895, 86.673, 88.918, 89.903, 91.916, 93.165, 90.209, 80.996, 84.873, 83.496, 81.280, 80.161, 81.288, 82.484]
  }, {
    type: 'column',
    color: '#6cbd56',
    name: 'Recycling inside Europe',
    data: [26.641, 27.781, 28.611, 31.823, 33.359, 34.597, 36.960, 38.906, 40.544, 43.174, 43.658, 44.800, 45.730, 47.641, 49.011, 50.731, 51.504, 50.184, 46.149, 49.800, 49.108, 48.420, 49.287, 49.511, 49.583]
  }, {
    type: 'column',
    color: '#009347',
    name: 'Recycling Outside Europe',
    data: [-0.512, -1.038, -0.598, -0.662, -0.319, 0.358, 0.725, 1.109, 2.339, 1.779, 2.347, 2.436, 3.029, 4.655, 6.587, 7.306, 8.535, 9.853, 12.058, 8.371, 9.406, 9.446, 8.319, 8.561, 9.384]
  }, {
    name: 'Recycling Rate',
    color: '#2f7cba',
    data: [40.3, 40.8, 42.5, 43.9, 46.6, 49.1, 49.2, 50.2, 52.2, 51.8, 54.8, 55.6, 56.3, 58.8, 61.8, 63.1, 64.4, 66.6, 71.9, 68.5, 70.1, 71.2, 71.9, 71.4, 71.5],
    marker: {
      lineWidth: 1,
      lineColor: '#2f7cba'
    }
  }]
});
.grafica {
width: 400px;
height: 400px;
}<div class="grafica" id="grafica1"></div>最佳答案
定义一个轴数组,第二个 yAxis 应链接到第一个轴并具有相反的属性:
yAxis: [{
  title: {
    text: ''
  }
}, {
  opposite: true,
  linkedTo: 0
}],
将 xAxis 网格线的宽度设置为某个正值,并且可以选择通过将其长度设置为 0 来隐藏刻度线:
xAxis: {
  categories: [],
  gridLineWidth: 1,
  tickLength: 0
},
绘图线类似于网格线,但更可自定义 - 请参阅 docs了解更多信息。
<小时/>实例:https://jsfiddle.net/fpg0q8ep/

关于javascript - Highcharts - 第二个 y 轴以及 x 和 y 方向的绘图线,我们在Stack Overflow上找到一个类似的问题: https://stackoverflow.com/questions/49252500/