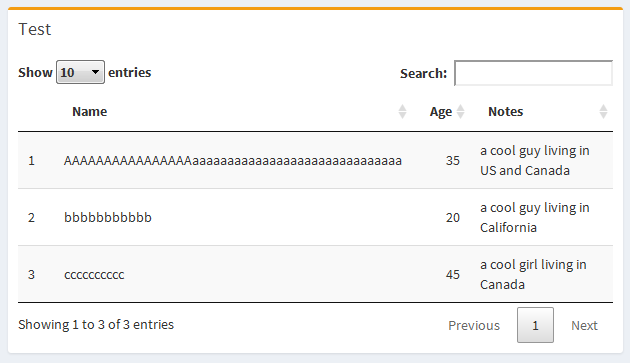
我正在构建一个显示数据表的 Shiny 仪表板。
我的目标是自动调整数据表的列宽以适应 1 行而不是多行中的单元格值。但是,我得到了以下结果:
似乎名称已按我想要的方式调整,但注释没有。然后,我点击了这些链接: https://rstudio.github.io/DT/options.html ,
Setting column width in R Shiny DataTable does not work in case of lots of column ,
R Shiny set DataTable column width
基本上,网上建议的解决方案是在渲染数据表时使用 autoWidth = TRUE 参数和 columnDefs 。
这对我来说也不起作用,结果如下:
与最初的结果相比,表格的宽度似乎变窄了
下面是我的最终代码:
header <- dashboardHeader(
  title = "Test"
)

sidebar <- dashboardSidebar(
)

body <- dashboardBody(
            box(title = "Test", width = 7, status = "warning", DT::dataTableOutput("df"))
)

# UI
ui <- dashboardPage(header, sidebar, body)

# Server
server <- function(input, output, session) {

  output$df = DT::renderDataTable(df, options = list(
    autoWidth = TRUE,
    columnDefs = list(list(width = '10px', targets = c(1,3)))))
    }

# Shiny dashboard
shiny::shinyApp(ui, server)
我不知道为什么Name列的宽度可以随着单元格值的长度调整,但Notes却不能。我也在其他项目中尝试过使用数据表,列的宽度只能通过列名的长度来调整。
在我的例子中,另一个选项是将列宽设置为仅一定数量的字符,并通过将鼠标悬停在单元格上来显示单元格值的完整上下文。此处建议解决方案:R Shiny Dashboard DataTable Column Width 。不过,这只是针对DT,但是当我将其集成到Shiny中时,它并没有起作用。
提前致谢。
最佳答案
如果您不需要多行,可以将 CSS 属性 white-space: nowrap 添加到所需列中的单元格。
由于您使用的是 Shiny,因此很容易做到这一点,只需定义一个 CSS 类并将其分配给 columnDefs 选项中的 className 列即可:
library(DT)
library(shiny)

dat <- data.frame(
  V1 = c("A", "B"),
  V2 = c(
    "A cool guy living in US and Canada",
    "A cool guy living in California"
  ),
  V3 = c(
    "A cool guy living in US and Canada",
    "A cool guy living in California"
  ),
  V4 = c(
    "A cool guy living in US and Canada",
    "A cool guy living in California"
  ),
  V5 = c(
    "A cool guy living in US and Canada",
    "A cool guy living in California"
  ),
  stringsAsFactors = FALSE
)

css <- "
.nowrap {
  white-space: nowrap;
}"

ui <- fluidPage(
  tags$head(
    tags$style(HTML(css))
  ),
  DTOutput("table")
)

server <- function(input, output){

  output[["table"]] <- renderDT({
    datatable(dat,
              options = list(
                columnDefs = list(
                  list(className = "nowrap", targets = "_all")
                )
              ))
  })
}

shinyApp(ui, server)
关于javascript - 如何在R Shiny数据表中设置列宽?,我们在Stack Overflow上找到一个类似的问题: https://stackoverflow.com/questions/55208855/


