我从后端 API 获取数据集,它对于相同的 x 轴和 y 轴将有多个数据标签。我如何才能针对“n”值实现此目的。
我尝试了 1,2, 4,它有效。但不确定这是否是正确的方法以及如何实现“n”值调整行大小和列大小。
Highcharts.chart('container', {
chart: {
type: 'heatmap',
marginTop: 40,
marginBottom: 80,
plotBorderWidth: 1
},
title: {
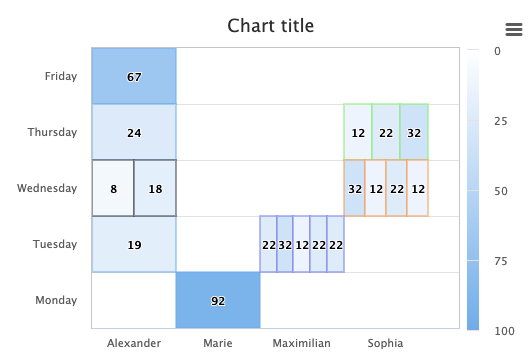
text: 'Sales per employee per weekday'
},
xAxis: {
min: 0,
categories: ['Alexander', 'Marie', 'Maximilian', 'Sophia', 'Lukas', 'Maria', 'Leon', 'Anna', 'Tim', 'Laura']
},
yAxis: {
categories: ['Monday', 'Tuesday', 'Wednesday', 'Thursday', 'Friday'],
title: null,
min: 0
},
colorAxis: {
min: 0,
minColor: '#FFFFFF',
maxColor: Highcharts.getOptions().colors[0]
},
legend: {
align: 'right',
layout: 'vertical',
margin: 0,
verticalAlign: 'top',
y: 25,
symbolHeight: 280
},
plotOptions: {
series: {
borderWidth: 1,
dataLabels: {
enabled: true,
color: '#000000'
},
states: {
inactive: {
opacity: 1
}
}
}
},
series: [{
name: 'Sales per employee',
data: [
[0, 1, 19],
[0, 2, 8],
[0, 3, 24],
[0, 4, 67],
[1, 0, 92],
[9, 4, 91]
]
}, {
rowsize: 0.5,
colsize: 0.5,
color: Highcharts.getOptions().colors[0],
data: [
[-0.25, 0.25, 70],
[0.25, 0.25, 60],
[-0.25, -0.25, 65],
[0.25, -0.25, 34]
]
}]
});最佳答案
我认为你的想法很好,但是为了更容易对齐点,你可以只创建列或行。
我在下面创建了一个函数,它为具有相同 x 和 y 值的点创建新系列,并将它们对齐在一行中。
function getSeries(data) {
    var i = 0,
        k,
        dataLength,
        movement,
        index = 0,
        colSize,
        limitVal,
        series = [{
            data: []
        }],
        newSeries;


    for (i; i < data.length; i++) {
        if (
            data[i + 1] &&
            data[i][0] === data[i + 1][0] &&
            data[i][1] === data[i + 1][1]
        ) {
            if (newSeries) {
                newSeries.data.push(data[i]);
            } else {
                newSeries = {
                    data: [data[i]]
                }
            }

        } else {
            if (newSeries) {
                newSeries.data.push(data[i]);
                dataLength = newSeries.data.length;
                newSeries.colsize = colSize = 1 / newSeries.data.length;

                movement = dataLength % 2 ? 0 : colSize / 2;

                limitVal = colSize * Math.floor(dataLength / 2) - movement;

                for (k = -limitVal; k <= limitVal; k += colSize) {
                    newSeries.data[index][0] += k;
                    index++;
                }

                series.push(newSeries);
                index = 0;
                newSeries = null;

            } else {
                series[0].data.push(data[i]);
            }
        }
    }

    return series
}

Highcharts.chart('container', {
    ...,

    series: getSeries(data)
});
关于javascript - 使用 javascript 以动态方式热图同一轴的多个数据标签,我们在Stack Overflow上找到一个类似的问题: https://stackoverflow.com/questions/57036047/