我正在尝试缩短 Y 轴上的值,目前它们显示如下:
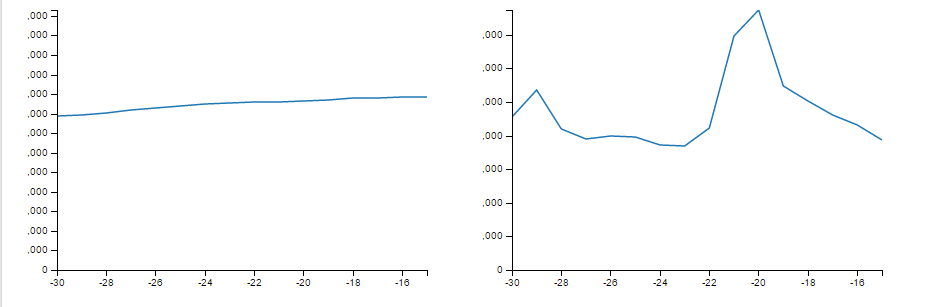
虽然我可以使用填充,但我希望 Y 轴以这种方式显示:
100,000 = 100k
200,000 = 200k
等等等等
附件是我的代码。
var paidSubChart = dc.lineChart("chart1")
.width(450)
.height(300)
.elasticX(true)
.x(d3.scale.linear().domain([-30,N]))
.elasticY(true)
.brushOn(false)
.yAxisLabel("Paid Subs")
.xAxisLabel("Days Since Launch")
.dimension(dayCountDimension)
.group(paidSubGroup);

var expansionActChart = dc.lineChart("chart2")
.width(450)
.height(300)
.elasticX(true)
.x(d3.scale.linear().domain([0,N]))
.elasticY(true)
.brushOn(false)
.yAxisLabel("Paid Subs")
.xAxisLabel("Days Since Launch")
.dimension(dayCountDimension)
.group(expActGroup);
最佳答案
dc.js 中的轴由 d3.js 提供。
我认为您正在寻找
chart.yAxis().tickFormat(d3.format('.3s'))
调用 d3.axis.tickFormat并使用d3.format的“SI 前缀”。
注意:最好将轴操作保留在单独的语句中,因为 stuff breaks if you try to chain other dc.js chart commands after a yAxis command .
关于javascript - 设置 dc.js/d3 图表中 y 轴值的格式,我们在Stack Overflow上找到一个类似的问题: https://stackoverflow.com/questions/38986826/