脚本
<link rel="stylesheet" href="//cdnjs.cloudflare.com/ajax/libs/morris.js/0.5.1/morris.css">
 <script src="//ajax.googleapis.com/ajax/libs/jquery/1.9.0/jquery.min.js"></script>
<script src="//cdnjs.cloudflare.com/ajax/libs/raphael/2.1.0/raphael-min.js"></script>
<script src="//cdnjs.cloudflare.com/ajax/libs/morris.js/0.5.1/morris.min.js"></script>
HTML 和 jQuery:
<div id="myfirstchart" style="height: 250px;"></div>
<Script>
new Morris.Bar({
// ID of the element in which to draw the chart.
element: 'myfirstchart',
// Chart data records -- each entry in this array corresponds to a point on
// the chart.
data: [
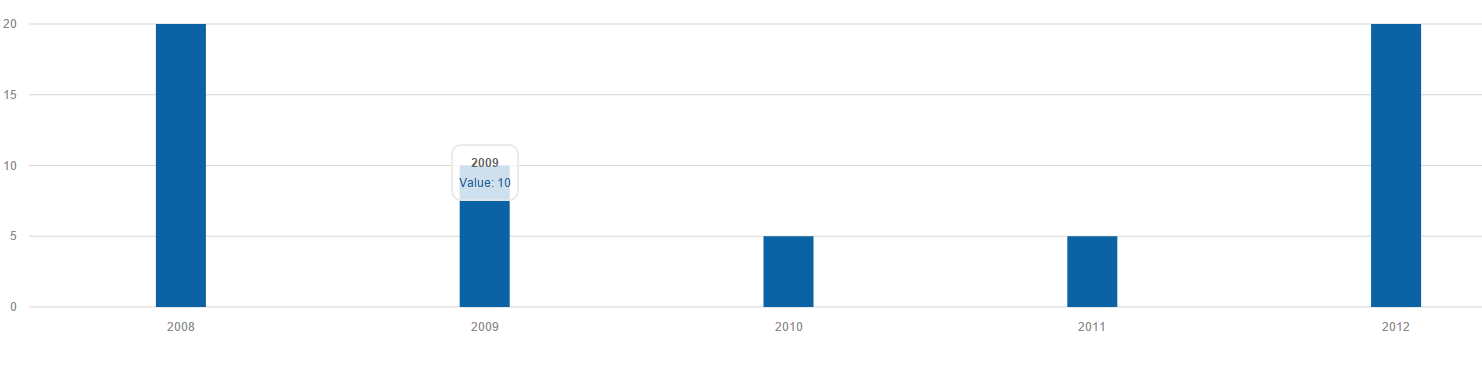
{ year: '2008', value: 20 },
{ year: '2009', value: 10 },
{ year: '2010', value: 5 },
{ year: '2011', value: 5 },
{ year: '2012', value: 20 }
],
// The name of the data record attribute that contains x-values.
xkey: 'year',
// A list of names of data record attributes that contain y-values.
ykeys: ['value'],
// Labels for the ykeys -- will be displayed when you hover over the
// chart.
labels: ['Value'],
barSize: 50
});
</Script>
图表渲染良好,但图表之间有很大的空间。
如何减少条形之间的间距?
图片:
最佳答案
您可以修改 barSize 来制作大条形。
示例:
barSize:120
或者,如果您想减少空间,您可以添加更多没有值的日期或定义图表的宽度。
带有大条的示例
new Morris.Bar({
  // ID of the element in which to draw the chart.

  element: 'myfirstchart',
  // Chart data records -- each entry in this array corresponds to a point on
  // the chart.
  data: [
    { year: '2008', value: 20 },
    { year: '2009', value: 10 },
    { year: '2010', value: 5 },
    { year: '2011', value: 5 },
    { year: '2012', value: 20 }
  ],
  // The name of the data record attribute that contains x-values.
  xkey: 'year',
  // A list of names of data record attributes that contain y-values.
  ykeys: ['value'],
  // Labels for the ykeys -- will be displayed when you hover over the
  // chart.
  labels: ['Value'],
  barSize: 120
});
<script src="https://ajax.googleapis.com/ajax/libs/jquery/2.1.1/jquery.min.js"></script>
<link href="http://cdnjs.cloudflare.com/ajax/libs/morris.js/0.5.1/morris.css" rel="stylesheet"/>
<script src="http://cdnjs.cloudflare.com/ajax/libs/raphael/2.1.0/raphael-min.js"></script>
<script src="http://cdnjs.cloudflare.com/ajax/libs/morris.js/0.5.1/morris.min.js"></script>
<div id="myfirstchart" style="height: 250px;"></div>包含更多日期的示例
new Morris.Bar({
  // ID of the element in which to draw the chart.

  element: 'myfirstchart',
  // Chart data records -- each entry in this array corresponds to a point on
  // the chart.
  data: [
    { year: '2008', value: 20 },
    { year: '2009', value: 10 },
    { year: '2010', value: 5 },
    { year: '2011', value: 5 },
    { year: '2012', value: 20 },
    { year: '2013', value: 0 },
    { year: '2014', value: 0 },
    { year: '2015', value: 0 },
    { year: '2016', value: 0 },
    { year: '2017', value: 0 },
    { year: '2018', value: 0 },
  ],
  // The name of the data record attribute that contains x-values.
  xkey: 'year',
  // A list of names of data record attributes that contain y-values.
  ykeys: ['value'],
  // Labels for the ykeys -- will be displayed when you hover over the
  // chart.
  labels: ['Value'],
  barSize: 120
});
<script src="https://ajax.googleapis.com/ajax/libs/jquery/2.1.1/jquery.min.js"></script>
<link href="http://cdnjs.cloudflare.com/ajax/libs/morris.js/0.5.1/morris.css" rel="stylesheet"/>
<script src="http://cdnjs.cloudflare.com/ajax/libs/raphael/2.1.0/raphael-min.js"></script>
<script src="http://cdnjs.cloudflare.com/ajax/libs/morris.js/0.5.1/morris.min.js"></script>
<div id="myfirstchart" style="height: 250px;"></div>宽度示例
new Morris.Bar({
  // ID of the element in which to draw the chart.

  element: 'myfirstchart',
  // Chart data records -- each entry in this array corresponds to a point on
  // the chart.
  data: [
    { year: '2008', value: 20 },
    { year: '2009', value: 10 },
    { year: '2010', value: 5 },
    { year: '2011', value: 5 },
    { year: '2012', value: 20 }
  ],
  // The name of the data record attribute that contains x-values.
  xkey: 'year',
  // A list of names of data record attributes that contain y-values.
  ykeys: ['value'],
  // Labels for the ykeys -- will be displayed when you hover over the
  // chart.
  labels: ['Value'],
  barSize: 120
});
<script src="https://ajax.googleapis.com/ajax/libs/jquery/2.1.1/jquery.min.js"></script>
<link href="http://cdnjs.cloudflare.com/ajax/libs/morris.js/0.5.1/morris.css" rel="stylesheet"/>
<script src="http://cdnjs.cloudflare.com/ajax/libs/raphael/2.1.0/raphael-min.js"></script>
<script src="http://cdnjs.cloudflare.com/ajax/libs/morris.js/0.5.1/morris.min.js"></script>
<div id="myfirstchart" style="height: 250px;width:50%"></div>关于javascript - 如何缩小莫里斯条形图之间的差距,我们在Stack Overflow上找到一个类似的问题: https://stackoverflow.com/questions/33690639/