鉴于我有来自 this link 的以下代码:
from plotly.subplots import make_subplots
import plotly.graph_objects as go

fig = make_subplots(rows=1, cols=2)

fig.add_trace(
    go.Scatter(x=[1, 2, 3], y=[4, 5, 6]),
    row=1, col=1
)

fig.add_trace(
    go.Scatter(x=[20, 30, 40], y=[50, 60, 70]),
    row=1, col=2
)

fig.update_layout(height=600, width=800, title_text="Subplots")
fig.show()
此代码中的问题是,xaxis 和 yaxis 没有任何标签。除此之外,当前代码仅对所有图应用一个标题,但我想对每个散点图应用不同的标题。
我怎样才能做到这一点?
最佳答案
The problem in this code is, the xaxis and yaxis does not have any label.
您可以通过对图形结构进行子集化来编辑任何轴:
fig['layout']['xaxis']['title']='Label x-axis 1'
Beside this, the current code applies only one title to all the plots
根据用户 shaik moeed 提到的绘图版本,您可以在图形定义中包含 subplot_titles:
fig = make_subplots(rows=1, cols=2, subplot_titles=('Subplot title1', 'Subplot title2'))
plotly :
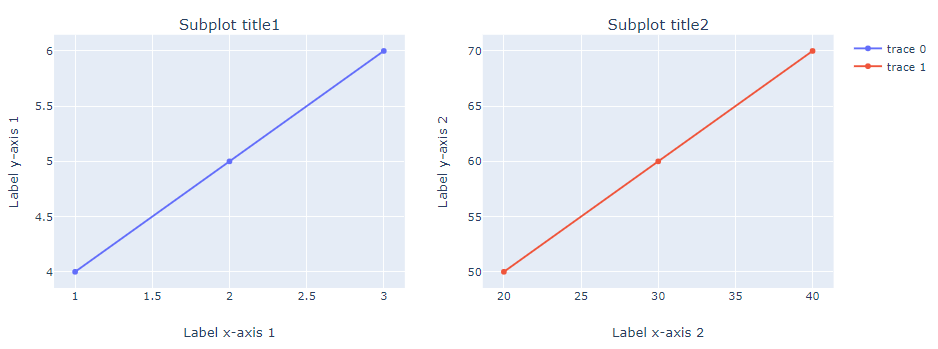
代码:
from plotly.subplots import make_subplots
import plotly.graph_objects as go


# plotly fig setup
fig = make_subplots(rows=1,
                    cols=2,
                    subplot_titles=('Subplot title1',  'Subplot title2'))

# traces
fig.add_trace(
    go.Scatter(x=[1, 2, 3], y=[4, 5, 6]),
    row=1, col=1
)

fig.add_trace(
    go.Scatter(x=[20, 30, 40], y=[50, 60, 70]),
    row=1, col=2
)

# edit axis labels
fig['layout']['xaxis']['title']='Label x-axis 1'
fig['layout']['xaxis2']['title']='Label x-axis 2'
fig['layout']['yaxis']['title']='Label y-axis 1'
fig['layout']['yaxis2']['title']='Label y-axis 2'

# plot it
fig.show()
关于python - Plotly:如何为每个不同的子图应用不同的标题?,我们在Stack Overflow上找到一个类似的问题: https://stackoverflow.com/questions/58849925/