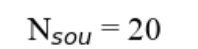
我使用 matplotlib 进行绘图并使用新的罗马字体。不过,在最新版本中,下标不再采用 Times New Roman 字体,而其他文本则采用 Times New Roman 字体。外观如下。
例如,代码如下,
import matplotlib as mlp,numpy as np
mlp.rc('font',family='Times New Roman')
import matplotlib.pyplot as plt
fig = plt.figure();
plt.xlabel('N$_{sou}$=20',fontsize=20)
plt.show()
图是
下标“sou”不是 Times New Roman,而“N”是 Times New Roman。
如何解决这个问题?
最佳答案
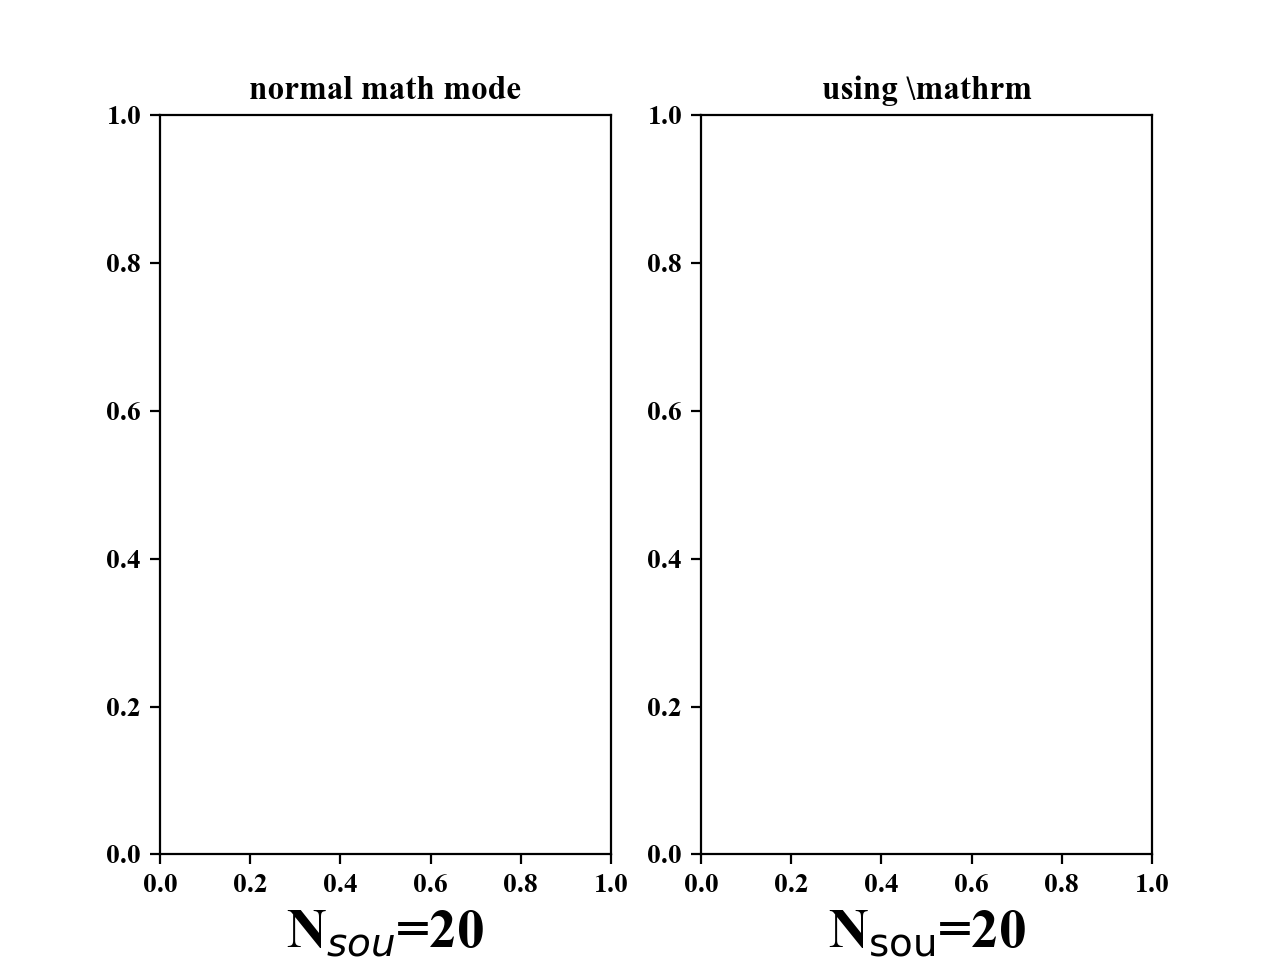
在 TeX 数学模式中,标准情况是使用专用数学字体(通常是您使用的字体的斜体版本)显示数学表达式。 Matplotlib 似乎模仿了这种行为。在 TeX(或 LaTeX)中,您可以使用 mathrm 恢复旧字体。命令,它似乎也可以在 matplotlib 中使用,如下所示:
import matplotlib as mlp,numpy as np
mlp.rc('font',family='Times New Roman')
import matplotlib.pyplot as plt
fig,axes = plt.subplots(1,2);
axes[0].set_xlabel('N$_{sou}$=20',fontsize=20)
axes[0].set_title('normal math mode')
axes[1].set_xlabel('N$_\mathrm{sou}$=20', fontsize=20)
axes[1].set_title('using \mathrm')
plt.show()
关于python - 使用 matplotlib 时下标不是新罗马字体,我们在Stack Overflow上找到一个类似的问题: https://stackoverflow.com/questions/51647923/