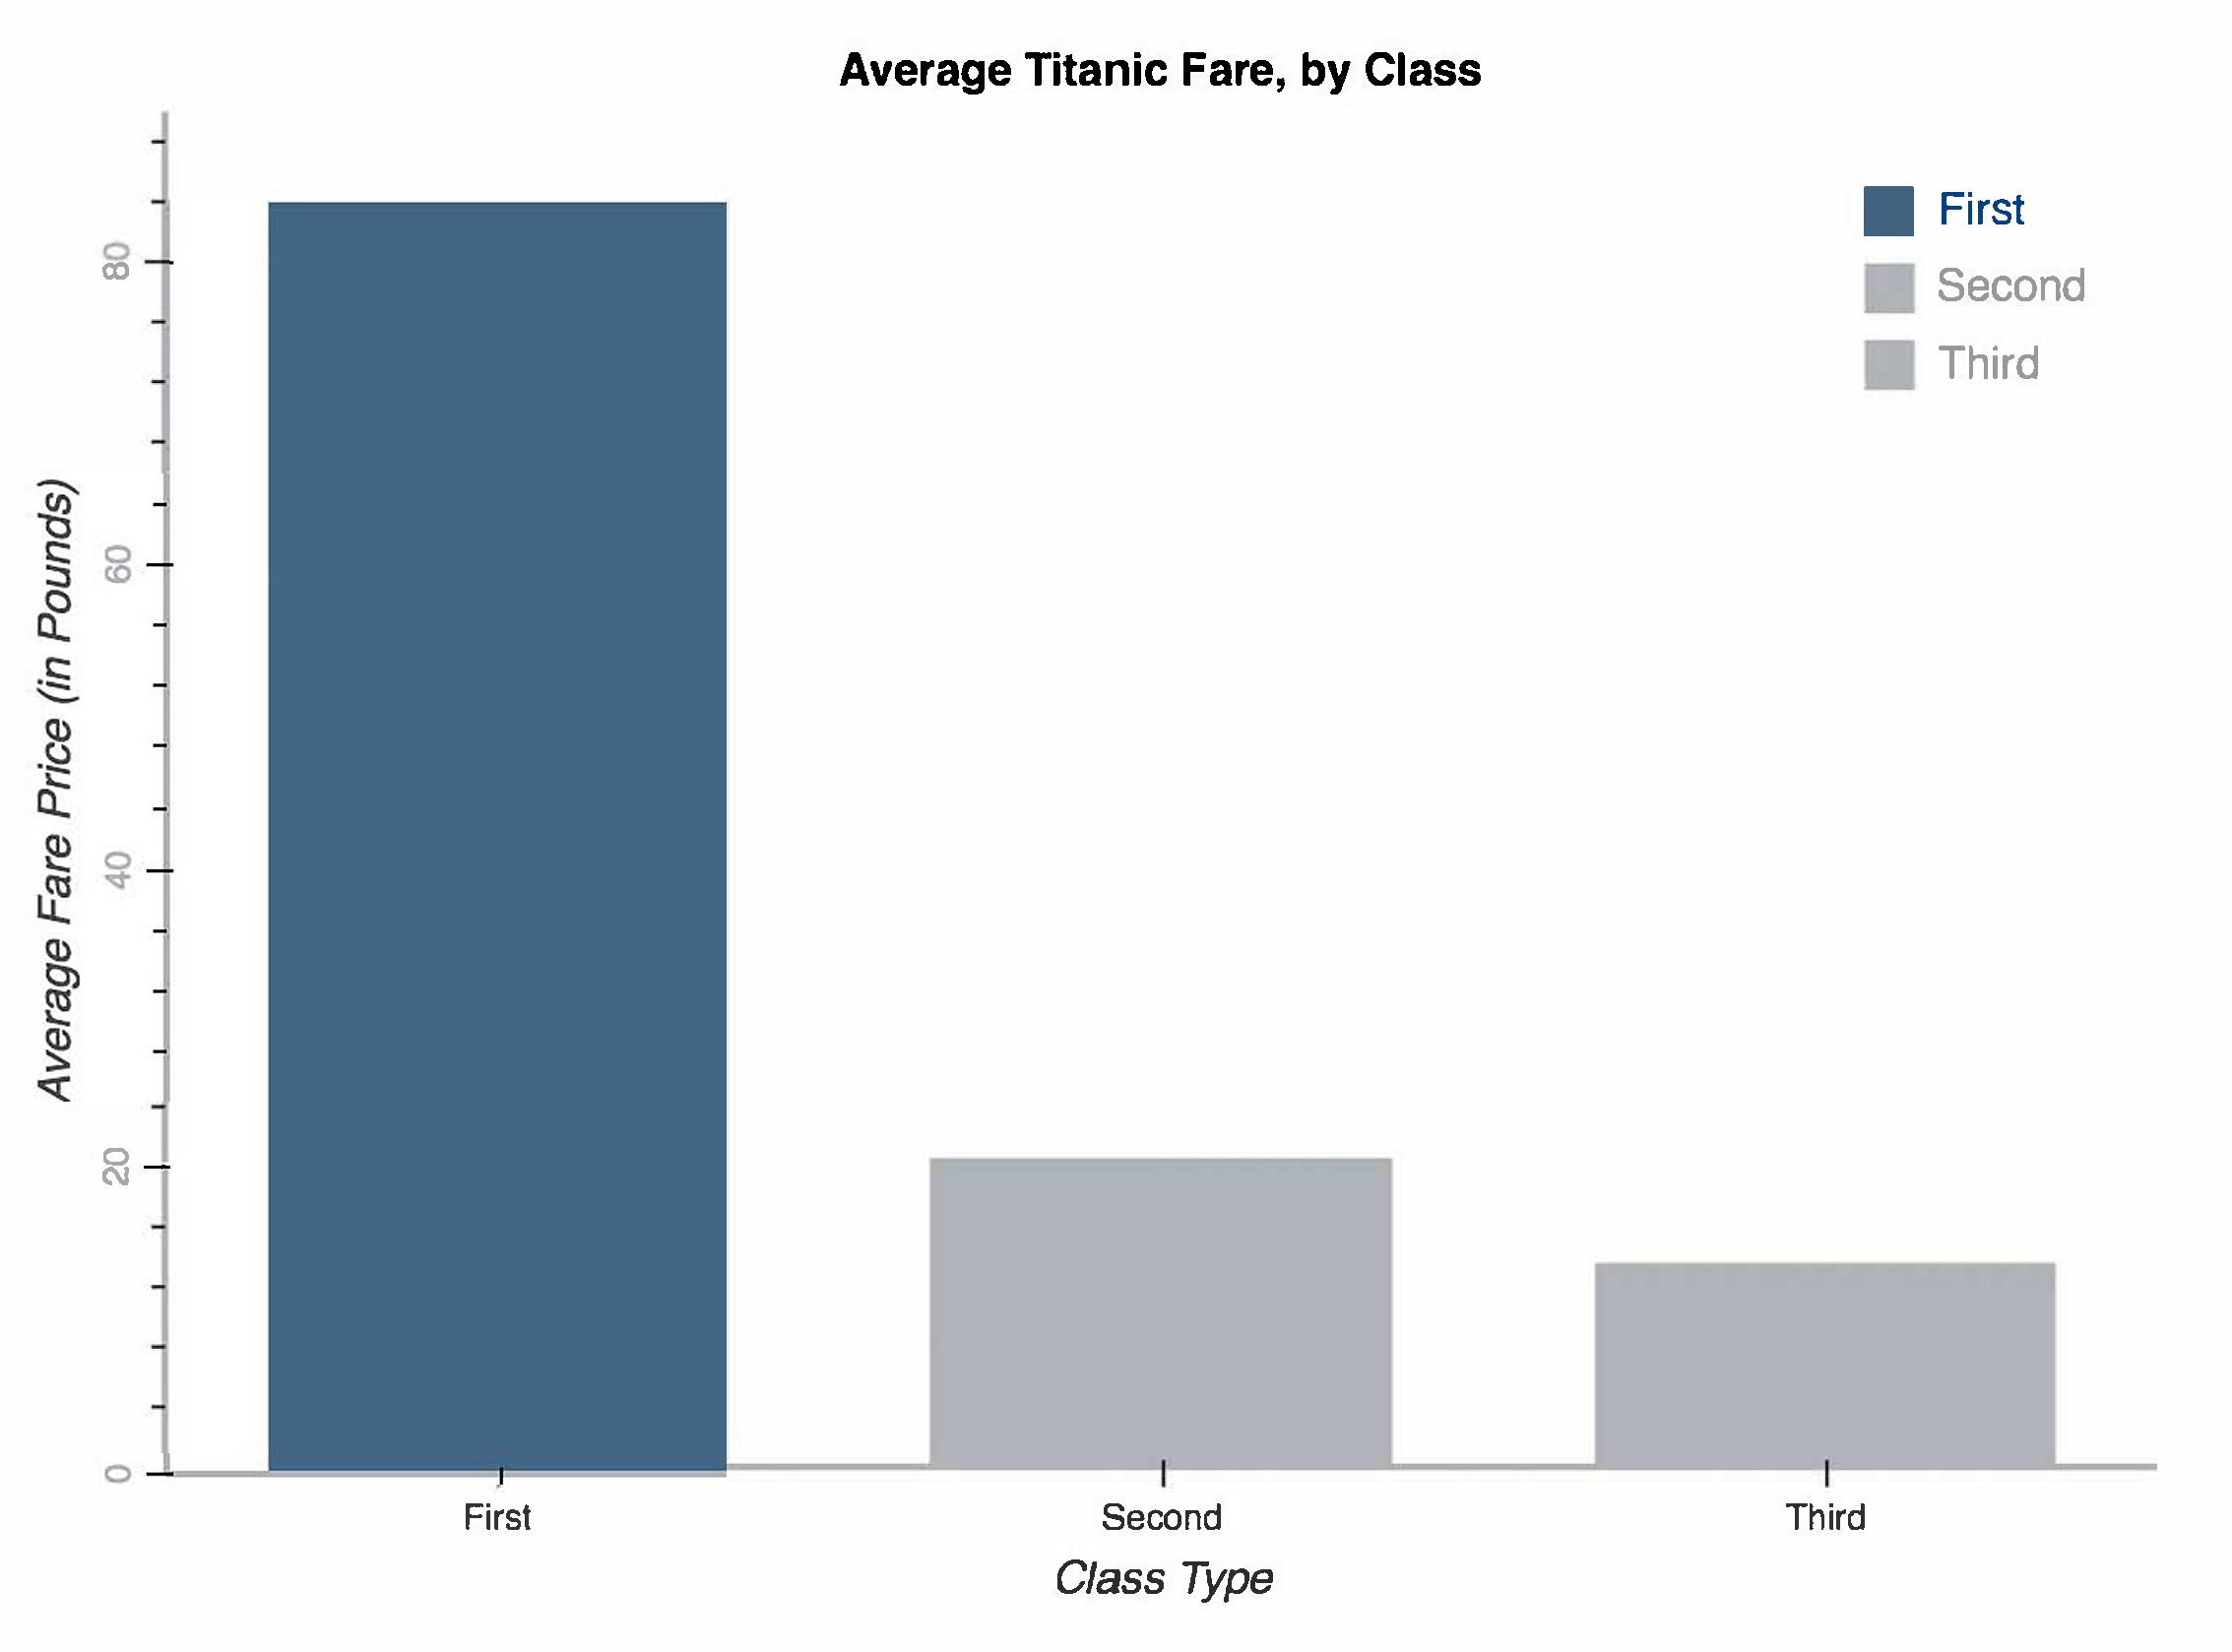
我正在使用泰坦尼克号数据集在 Bokeh 中制作一个简单的条形图。我发现该框架非常灵活,但是我想控制最后一个图表元素:图例文本的各个颜色。
查看此处的引用文档 ->
http://docs.bokeh.org/en/latest/docs/user_guide/styling.html#legends
我可以看到如何调整图例文本的颜色(作为一个整体),但是我希望能够将“First”的颜色与我的列颜色匹配相同的颜色(即#3a6587),并且“第二”和“第三”作为颜色#aeb3b7
我在下面包含了我的示例代码:
from bokeh.io import show, output_file
from bokeh.models import ColumnDataSource
from bokeh.palettes import Spectral6
from bokeh.plotting import figure
from bokeh.transform import factor_cmap

output_file("bar_colormapped.html")

ticket = ['First', 'Second', 'Third']
counts = [84.15, 20.66, 13.68]


# .var width parameter controls the width of the columns
# We can add the colours to the barchart as part of a palette list.
# Note the width to height ration should be 1.618:1 ish ;-)

source = ColumnDataSource(data=dict(ticket=ticket, counts=counts))

p = figure(x_range=ticket, plot_height=480, plot_width= 647, toolbar_location=None,
    title="Average Titanic Fare, by Class")
p.vbar(x='ticket', top='counts', width=0.7, source=source, legend="ticket",
       line_color='white', fill_color=factor_cmap('ticket',
        palette=['#3a6587', '#aeb3b7', '#aeb3b7'], factors=ticket))


# Removes the chart gridlines (i.e.. removes the chart clutter)
p.xgrid.grid_line_color = None
p.ygrid.grid_line_color = None

# change just some things about the x-axes
p.xaxis.axis_label = "Class Type"
p.xaxis.axis_line_width = 2
p.yaxis.major_label_text_color = "#aeb3b7"
p.xaxis.axis_line_color = "#aeb3b7"


# change just some things about the y-axes
p.yaxis.axis_label = "Average Fare Price (in Pounds)"
p.yaxis.axis_line_width = 2
p.yaxis.major_label_text_color = "#aeb3b7"
p.yaxis.axis_line_color = "#aeb3b7"
p.yaxis.major_label_orientation = "vertical"


# Set the range of the chart
p.y_range.start = 0
p.y_range.end = 90


# Remove the border. Set the width to 0 does not work so we need
# to set to 0.1 to make it less visible.
p.outline_line_width = 0.1

# Set attributes for the chart title
p.title.text_color = "black"
#p.title.text_font = "times"
#p.title.text_font_style = "italic"
p.title.align = "center"


# Set the position and orientation of the legend and remove
# the legend border
p.legend.orientation = "vertical"
p.legend.location = "top_right"
p.legend.border_line_width = 0.1


show(p)
下面包含建议图像的模型:
最佳答案
从 Bokeh 1.0.4 开始,图例仅支持所有条目使用单一文本颜色。以前没有人问过这个问题,但在 GitHub 上提出有关此问题的功能请求是合理的(特别是如果您有兴趣帮助贡献的话)。
关于python - 有没有办法在 Bokeh 图中拥有多个图例颜色文本?,我们在Stack Overflow上找到一个类似的问题: https://stackoverflow.com/questions/54368462/