通常两个 y 轴用不同的颜色分开,如下例所示。
对于出版物来说,通常需要保持其可区分性,即使它是黑白打印的。
这通常是通过围绕一条线绘制圆圈来完成的,这些圆圈带有一个指向相应轴方向的箭头。
如何使用 matplotlib 实现这一点?或者有没有更好的方法来实现没有这些圆圈的黑白可读性?
代码来自matplotlib.org :
import numpy as np
import matplotlib.pyplot as plt

# Create some mock data
t = np.arange(0.01, 10.0, 0.01)
data1 = np.exp(t)
data2 = np.sin(2 * np.pi * t)

fig, ax1 = plt.subplots()

color = 'tab:red'
ax1.set_xlabel('time (s)')
ax1.set_ylabel('exp', color=color)
ax1.plot(t, data1, color=color)
ax1.tick_params(axis='y', labelcolor=color)

ax2 = ax1.twinx()  # instantiate a second axes that shares the same x-axis

color = 'tab:blue'
ax2.set_ylabel('sin', color=color)  # we already handled the x-label with ax1
ax2.plot(t, data2, color=color)
ax2.tick_params(axis='y', labelcolor=color)

fig.tight_layout()  # otherwise the right y-label is slightly clipped
plt.show()

最佳答案
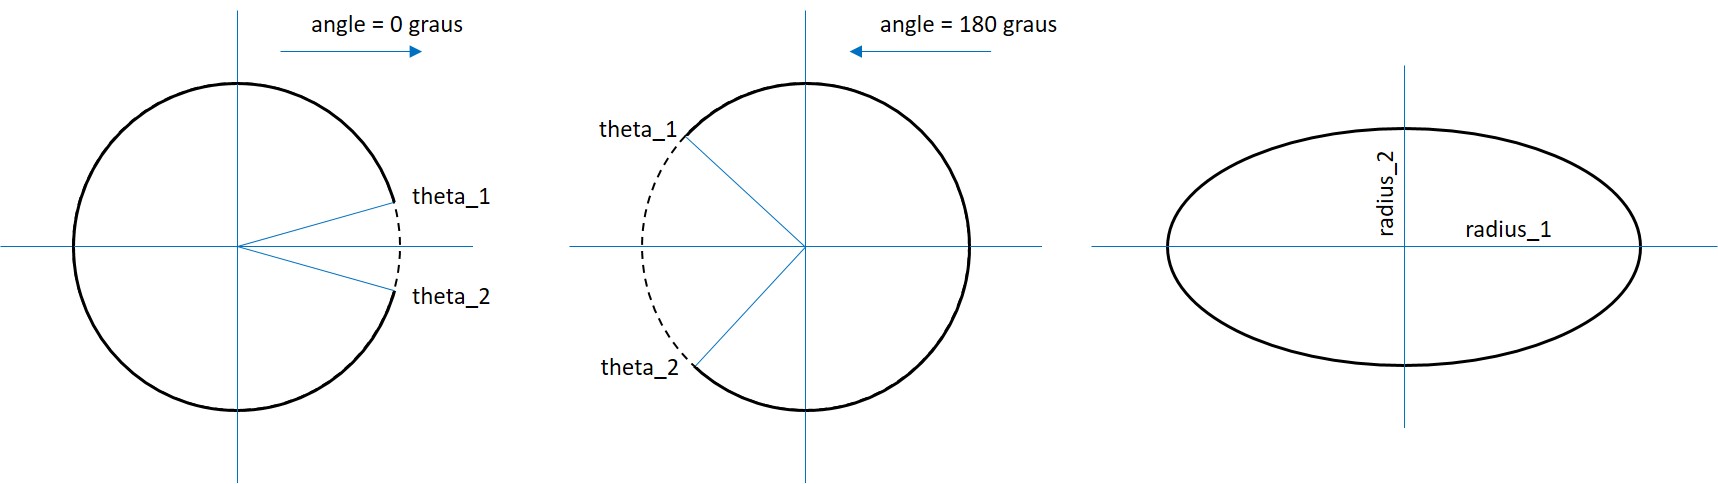
这个方法是基于这个answer 。它使用arc,可以按如下方式配置:
import matplotlib.pyplot as plt
from matplotlib.patches import Arc

# Generate example graph
fig = plt.figure(figsize=(5, 5))
ax = fig.add_subplot(1, 1, 1)
ax.plot([1,2,3,4,5,6], [2,4,6,8,10,12])

# Configure arc
center_x = 2            # x coordinate
center_y = 3.8          # y coordinate
radius_1 = 0.25         # radius 1
radius_2 = 1            # radius 2 >> for cicle: radius_2 = 2 x radius_1
angle = 180             # orientation
theta_1 = 70            # arc starts at this angle
theta_2 = 290           # arc finishes at this angle
arc = Arc([center_x, center_y],
          radius_1,
          radius_2,
          angle = angle,
          theta1 = theta_1,
          theta2=theta_2,
          capstyle = 'round',
          linestyle='-',
          lw=1,
          color = 'black')

# Add arc
ax.add_patch(arc)

# Add arrow
x1 = 1.9            # x coordinate
y1 = 4              # y coordinate
length_x = -0.5     # length on the x axis (negative so the arrow points to the left)
length_y = 0        # length on the y axis
ax.arrow(x1,
         y1,
         length_x,
         length_y,
         head_width=0.1,
         head_length=0.05,
         fc='k',
         ec='k',
         linewidth = 0.6)
结果如下所示:

关于python - Matplotlib 辅助/双轴 - 用圆圈和箭头标记 - 用于黑白 (bw) 发布,我们在Stack Overflow上找到一个类似的问题: https://stackoverflow.com/questions/57555215/