我最近开始使用 Python,但我不明白如何绘制给定数据(或数据集)的置信区间。
我已经有一个函数,可以在给定一组测量值的情况下根据传递给它的置信水平来计算上限和下限,但是如何使用这两个值来绘制置信区间?
最佳答案
有几种方法可以实现您的要求:
仅使用matplotlib
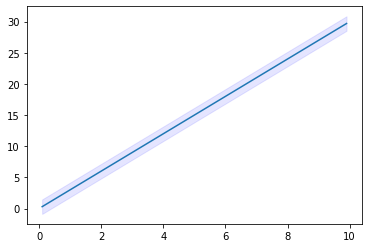
from matplotlib import pyplot as plt
import numpy as np

#some example data
x = np.linspace(0.1, 9.9, 20)
y = 3.0 * x
#some confidence interval
ci = 1.96 * np.std(y)/np.sqrt(len(x))

fig, ax = plt.subplots()
ax.plot(x,y)
ax.fill_between(x, (y-ci), (y+ci), color='b', alpha=.1)
fill_ Between 可以满足您的要求。有关如何使用此功能的更多信息,请参见:https://matplotlib.org/3.1.1/api/_as_gen/matplotlib.pyplot.fill_between.html
输出
或者,选择 seaborn,它使用 lineplot 或 regplot 支持此操作,
请参阅:https://seaborn.pydata.org/generated/seaborn.lineplot.html
关于python - 如何在 Python 中绘制置信区间?,我们在Stack Overflow上找到一个类似的问题: https://stackoverflow.com/questions/59747313/