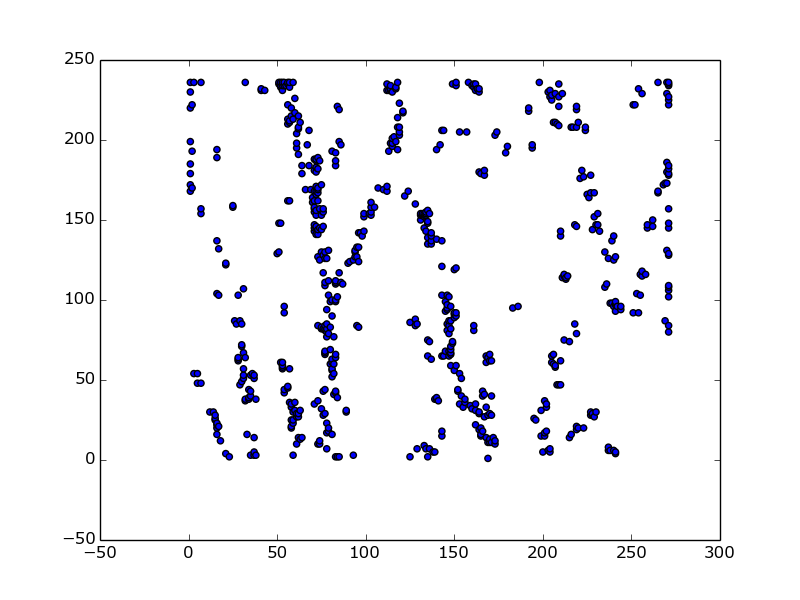
初学者使用 python,我有一个散点图( /image/sQNHM.png )。我想要做的是生成一个 3D 图,显示这些点在 Z 方向上的尖峰,而其他地方的尖峰为 0。
这是我当前使用的代码:
plt.scatter(X, Y)
plt.show()

X, Y = np.meshgrid(X, Y)
Z = [1] * len(X)
fig = plt.figure()
ax = fig.add_subplot(1,1,1, projection='3d')
ax.set_xlabel('X')
ax.set_ylabel('Y')
ax.set_zlabel('Z')
ax.plot_surface(X, Y, Z)
plt.show()
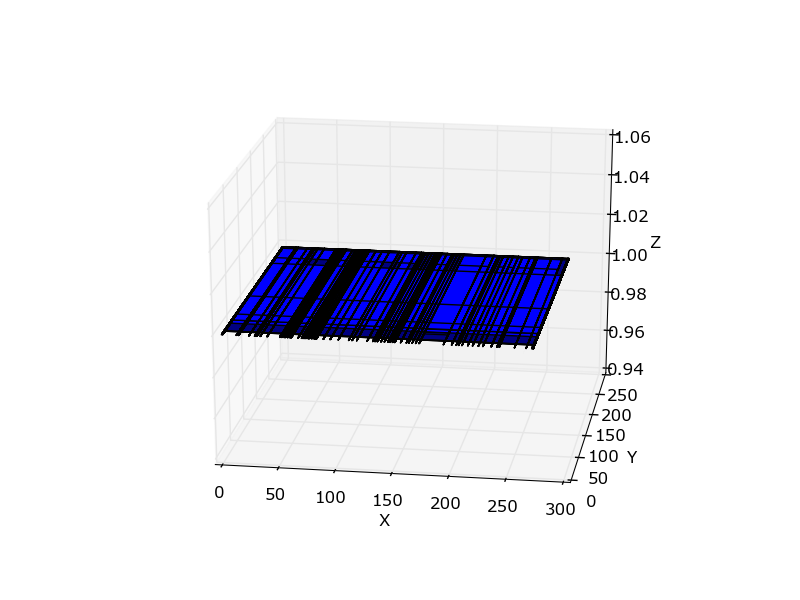
这给了我一个奇怪的结果( /image/7fLeT.png ),我不知道如何修复它。
最佳答案
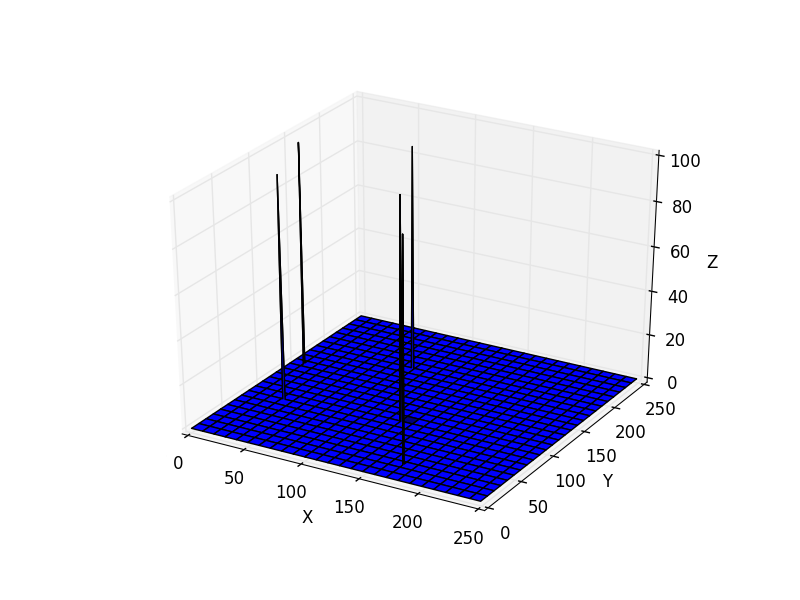
您可能不想使用 2D 图中的 x 和 y 值作为网格网格的输入,因为您希望为范围内的 x 和 y 的所有整数值定义该图。如果我正确理解你的问题,原始的 x 和 y 应该定义尖峰的位置。以下是在定义位置获取高度为 100 的尖峰的 3D 绘图的方法:
from matplotlib import pyplot as plt
import numpy as np
import matplotlib.pyplot as plt
from mpl_toolkits.mplot3d import Axes3D

# Create X, Y and Z arrays
x = range(0,250)
y = range(0,250)
X, Y = np.meshgrid(x, y)
Z = np.zeros((250,250))
# Locations of the spikes. These are some made up numbers.
dataX = np.array([25,80,90,145,180])
dataY = np.array([170,32,130,10,88])
# Set spikes to 100
Z[dataX,dataY] = 100
# Plot
fig = plt.figure()
ax = fig.add_subplot(1,1,1, projection='3d')
ax.set_xlabel('X')
ax.set_ylabel('Y')
ax.set_zlabel('Z')
ax.plot_surface(X, Y, Z)
plt.show()
关于python - 如何将散点图转换为曲面图?,我们在Stack Overflow上找到一个类似的问题: https://stackoverflow.com/questions/31159842/