我正在尝试在 map 上使用风速的 pcolormesh 覆盖风场的颤动图。
from mpl_toolkits.basemap import Basemap
from pylab import *

lonMin = 115.5
lonMax = 124.5
latMin = 10
latMax = 20

res = 0.25
lonGrid = arange(lonMin, lonMax, res)
latGrid = arange(latMin, latMax, res)
lonGrid,latGrid = meshgrid(lonGrid,latGrid)

u = random(lonGrid.shape)
v = random(lonGrid.shape)
m = Basemap(llcrnrlon=lonMin,llcrnrlat=latMin,urcrnrlon=lonMax,urcrnrlat=latMax, resolution = 'i')

m.pcolormesh(lonGrid, latGrid, sqrt(u**2+v**2))
m.quiver(lonGrid,latGrid,u,v, latlon = 'true')
m.drawcoastlines()
m.fillcontinents()
这给了我类似下面的图
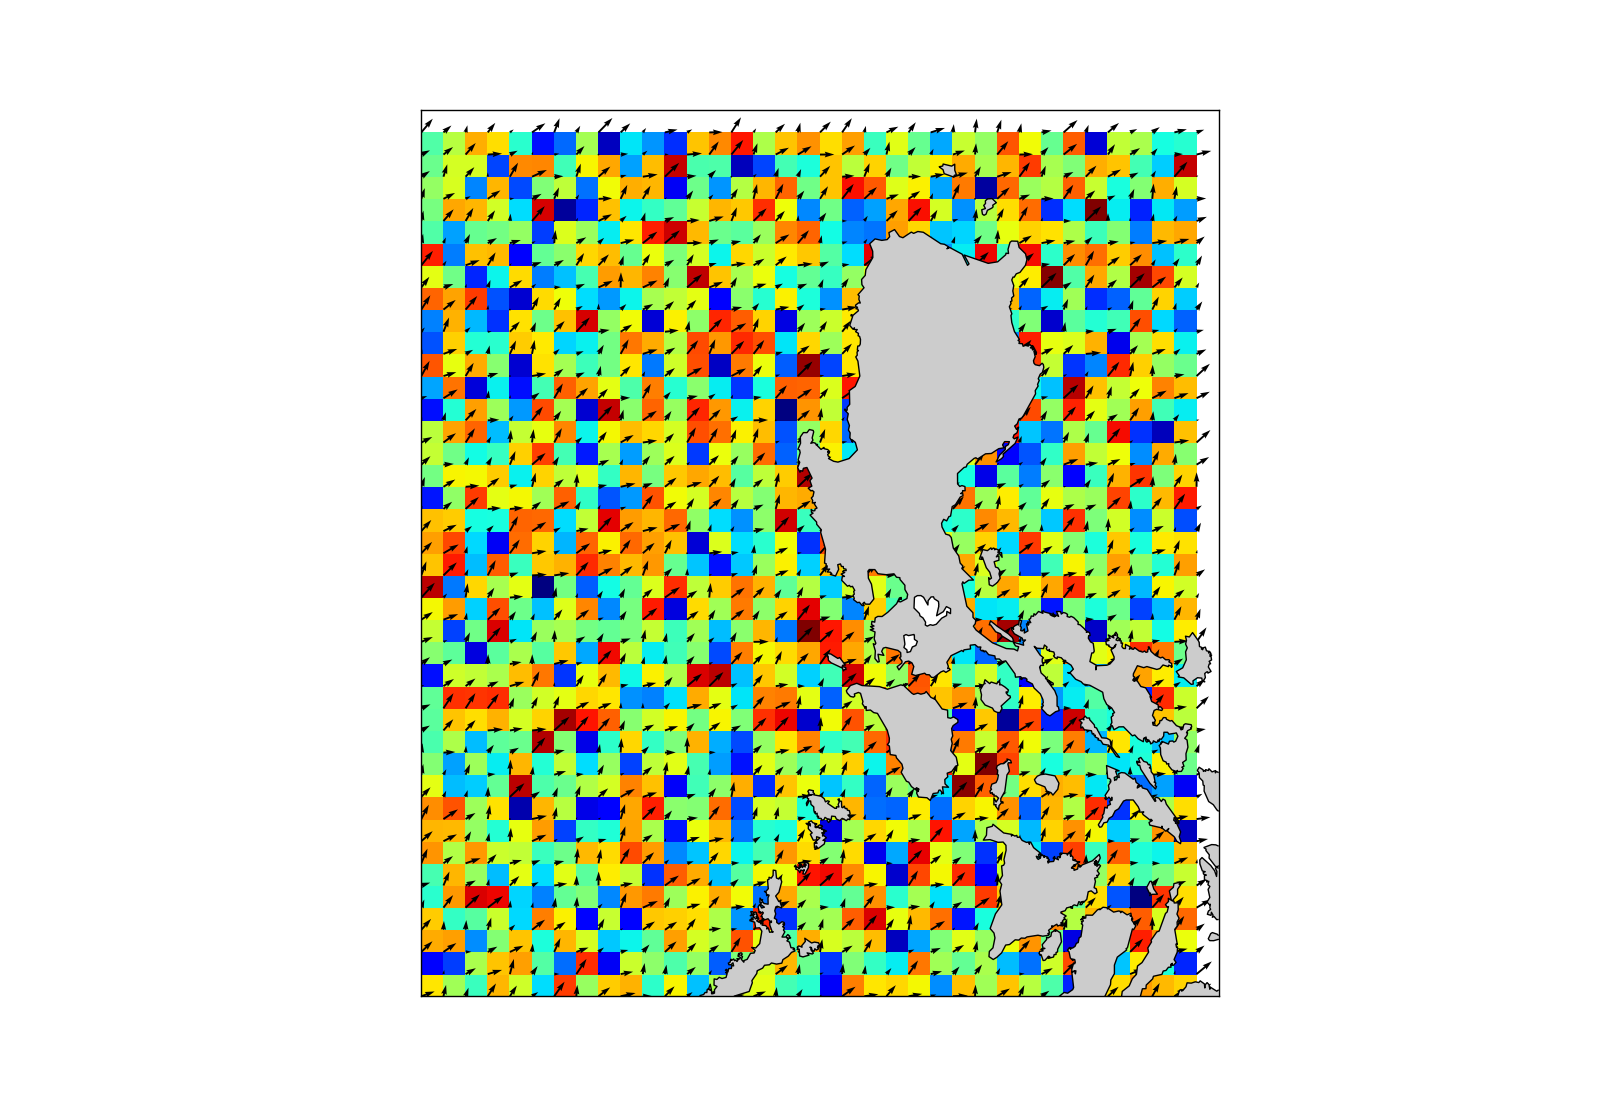
我注意到两件事:
- 箭袋箭头从 pcolormesh 生成的像素的左下角发出,而不是中心
- 绘图的上边框和最右边框未着色
这里到底发生了什么,我该如何解决它?
最佳答案
您的代码存在一些问题。
首先,避免使用 from pylab import *,这会严重污染你的命名空间。
其次,顶部和右侧的数据丢失:这是由于 pcolormesh 的行为造成的,它模仿了 MATLAB 的同名函数。引用the functionally similar pcolor的文档对此进行了解释:
pcolor(X, Y, C, **kwargs)[...]
Ideally the dimensions of X and Y should be one greater than those of C; if the dimensions are the same, then the last row and column of C will be ignored.
因此,您可以通过使用纬度/经度辅助数组来消除空边框。或者,我建议使用 imshow,其 basemap 版本会自动调整比例,以便绘制的图像跨越可见 map 。将您的 pcolormesh 调用切换到
m.imshow(sqrt(u**2+v**2),interpolation='none')
你得到了
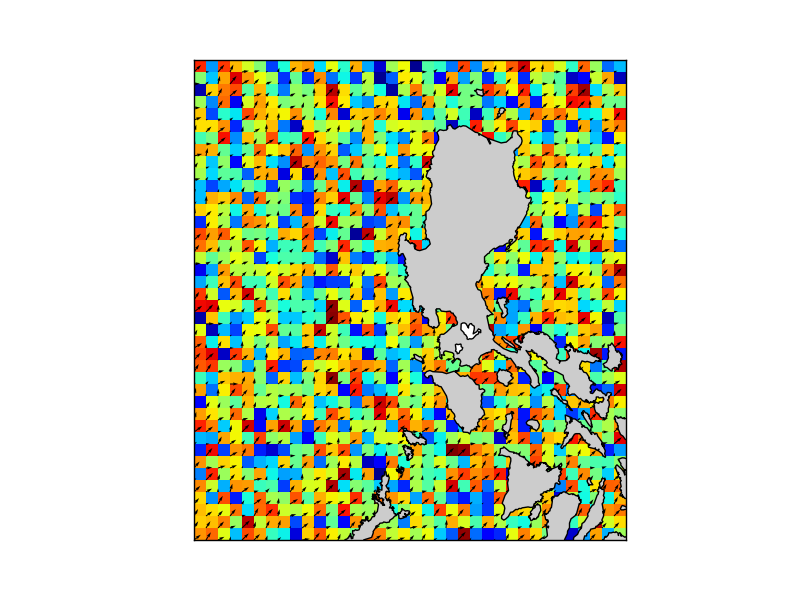
现在,最后一个问题是如何可视化数据。您的数据是什么?在上图中,数据点对应于每个“像素”的右下角,即您的 (lat,lon) 点所在的位置。所以现在的可视化是这样的:每个箭头从它对应的点开始,每个像素对应其左下角的数据。
您想要做的是以某种方式将这些箭头移动到像素中心。如果你想要精确,你实际上需要移动像素,因为根据定义,颤动图就在它应该在的位置。另一种选择是按原样保留 map ,并移动箭袋图(此版本背后的基本原理是离散化数据,并且在像素尺度上,将箭头/像素放在哪里并不重要)。
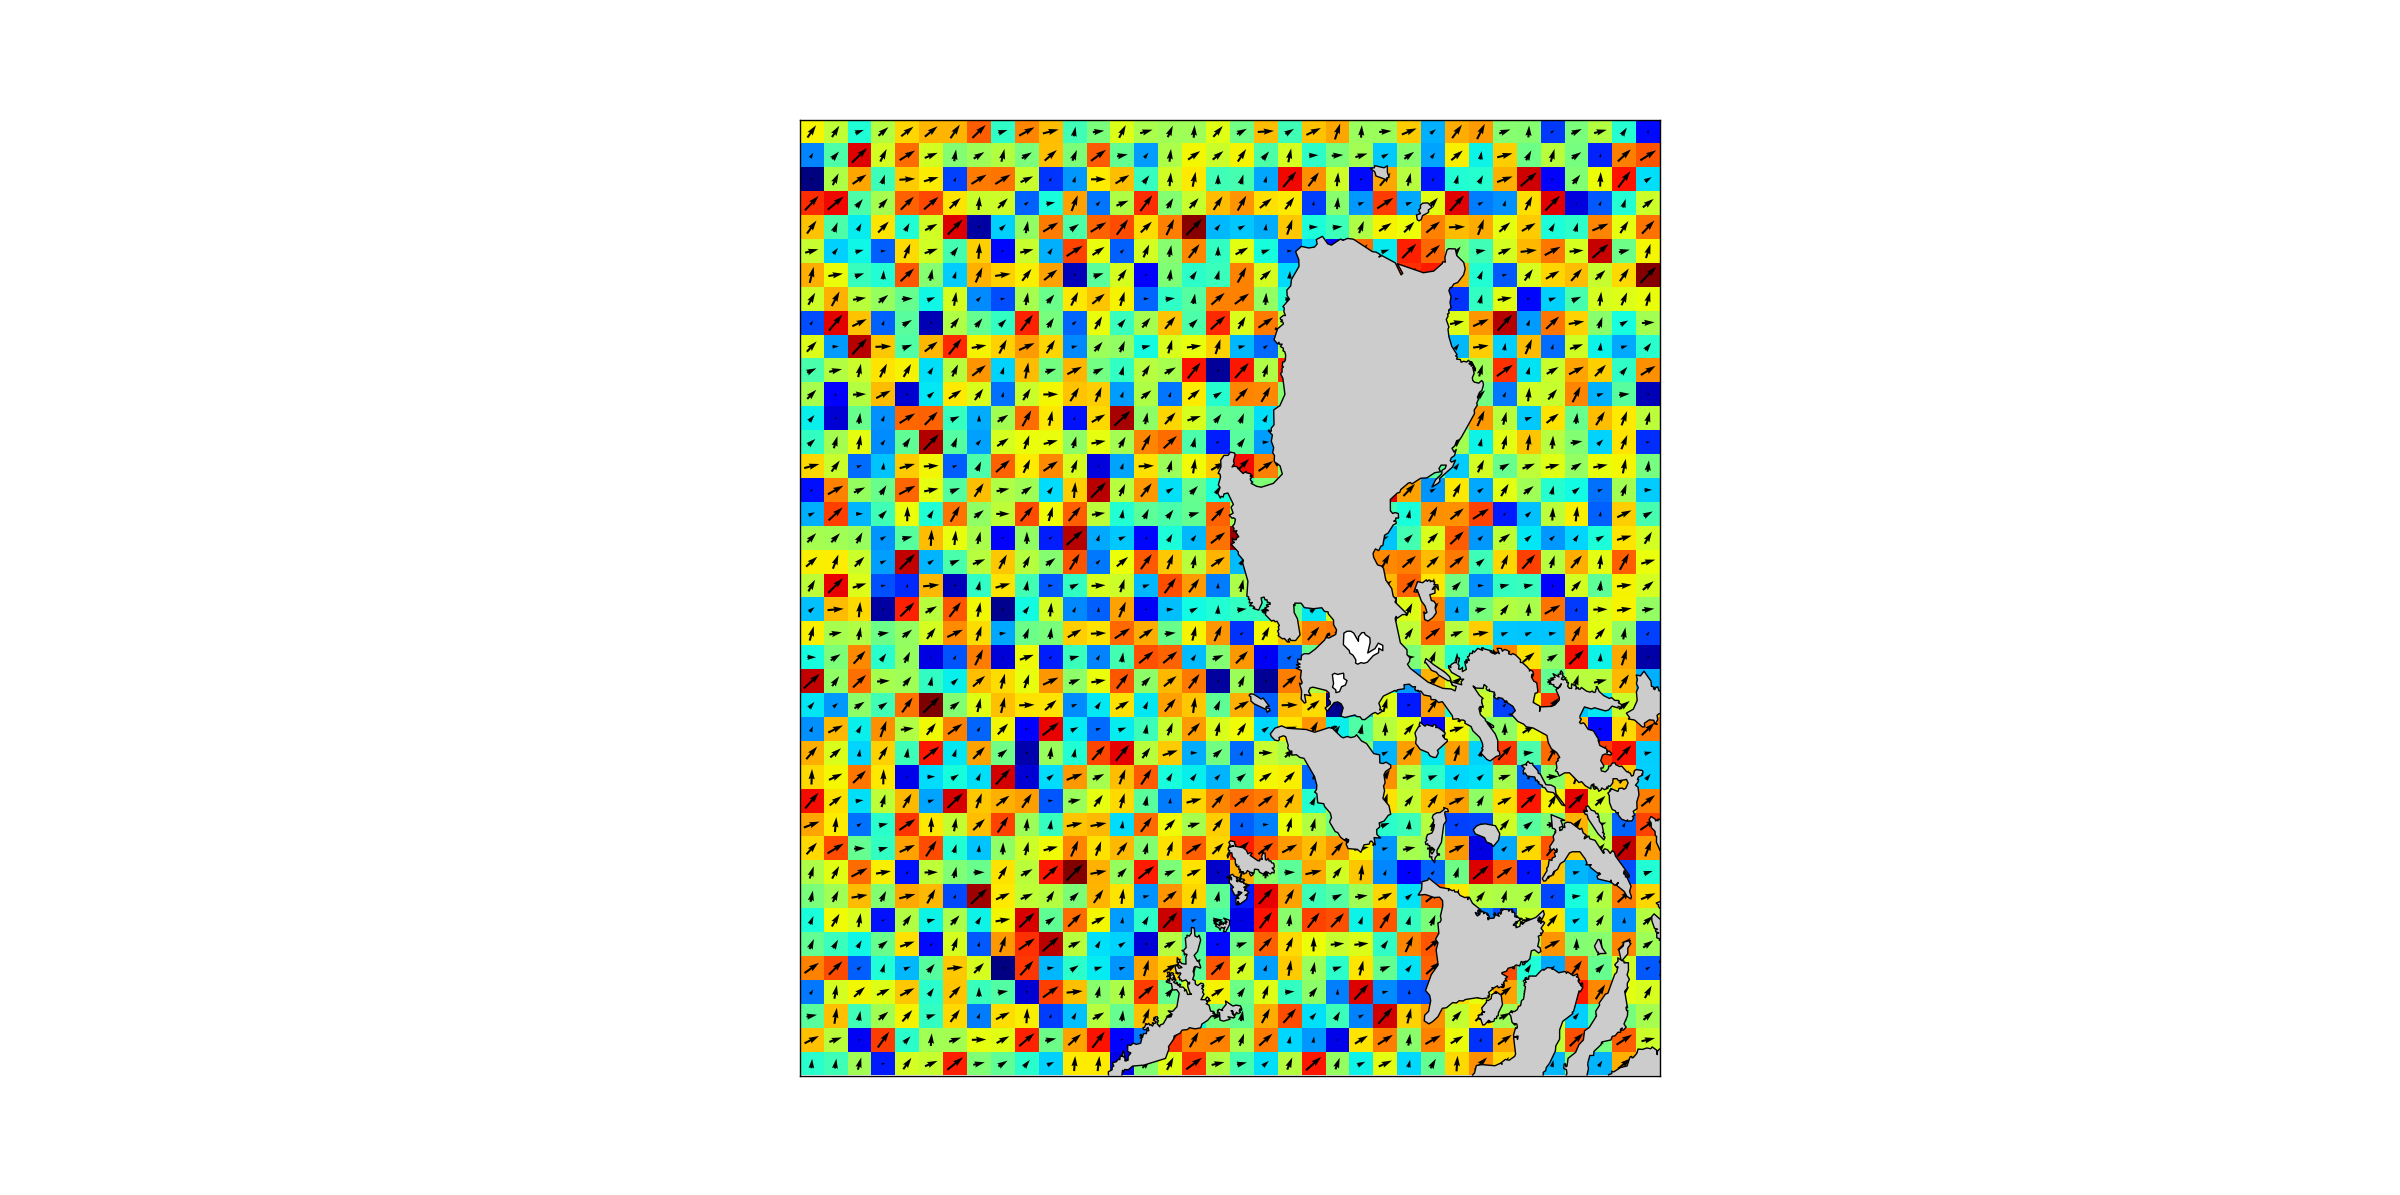
因为在我看来,如果你的箭袋箭头保持在原来的位置会更准确,所以我建议将整个 basemap 移动半个(lat,lon)单位,以便像素以实际数据为中心点。您可以通过将 pivot='middle' 选项传递给 quiver 使其变得最漂亮:在这种情况下,您的箭头将以数据点为中心(位于每个数据点的中间)像素)而不是源自所述点:
from mpl_toolkits.basemap import Basemap
#from pylab import *
from pylab import arange,meshgrid,random,sqrt

lonMin = 115.5
lonMax = 124.5
latMin = 10
latMax = 20

res = 0.25
lonGrid = arange(lonMin, lonMax, res)
latGrid = arange(latMin, latMax, res)
lonGrid,latGrid = meshgrid(lonGrid,latGrid)

u = random(lonGrid.shape)
v = random(lonGrid.shape)
m = Basemap(llcrnrlon=lonMin-res/2,llcrnrlat=latMin-res/2,
            urcrnrlon=lonMax-res/2,urcrnrlat=latMax-res/2,
            resolution='i') # shifted!
# data corresponds to (latGrid,lonGrid)
# basemap plot is shifted with (-res/2,-res/2)
# imshow will automatically use the visible map anyway

m.imshow(sqrt(u**2+v**2), interpolation='none')
m.quiver(lonGrid,latGrid,u,v, latlon='true', pivot='middle')
m.drawcoastlines()
m.fillcontinents()
生成的图看起来相当不错,现在也很明显颜色与箭头的大小相关:
关于Python quiver 和 pcolormesh 没有完全正确排列,我们在Stack Overflow上找到一个类似的问题: https://stackoverflow.com/questions/40899350/