我正在尝试使用 matplotlib 和 python 绘制两个函数 func1 和 func2。我不断收到以下代码的 ValueError 错误,但不知道出了什么问题。我搜索了相关问题,尝试了很多东西,但似乎没有任何效果。
import numpy as np
import matplotlib.pyplot as plt
fig, ax = plt.subplots(1, 1)
plt.xlim(0, 10)
plt.ylim(0, 10)
plt.xlabel('$X$')
plt.ylabel('$Outputs$')
plt.title('Title')
x = np.arange(0, 10, .1)
def func1(X):
output = max(3*X/7 - 3/7, 0, 12*X/35 - 3/35)
return output
def func2(X):
output = max(3*X/7 - 3/7, 0)
return output
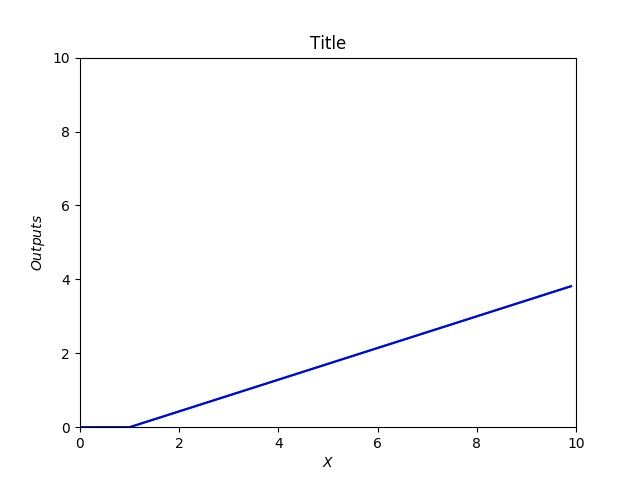
plt.plot(x, func1(x), 'g')
plt.plot(x , func2(x), 'b')
plt.show()
最佳答案
max(2,3) 显然是 3,因为 3 > 2。
但是当我们比较 ndarray 参数时,我们得到的不是单个标量结果,而是一个数组:
In [23]: np.array([3,1]) > np.array([1,2])
Out[23]: array([ True, False], dtype=bool)
我们无法将 bool 数组转换为单个值——它应该是 True,因为至少有一个,还是 False,因为它不全是 True?或者,正如错误消息所说,“具有多个元素的数组的真值不明确”。这意味着内置 max 函数会失败,因为它尝试根据比较是否正确进行分支。
幸运的是,因为看起来你想要成对最大值,numpy 已经有一个函数可以处理这个问题,np.maximum 。将代码中的内置 max 替换为 np.maximum 可以得到:
关于Python matplotlib 值错误 : The truth value of an array with more than one element is ambiguous,我们在Stack Overflow上找到一个类似的问题: https://stackoverflow.com/questions/42101986/