我正在尝试使用 Python 中的 Statsmodels 进行一些多元线性回归,但在组织数据时我遇到了一些心理障碍。
默认的波士顿数据集如下所示:

线性回归模型的输出是这样的:

我的原始数据是用空格分隔的,如下所示:
我已经能够将它排列到这里的数组中:

有更多 Python 经验的人知道如何以与波士顿数据集类似的方式格式化我的数据,以便我可以轻松地执行我的回归模型吗?例如,设置与我的数据索引相对应的 feature_names。
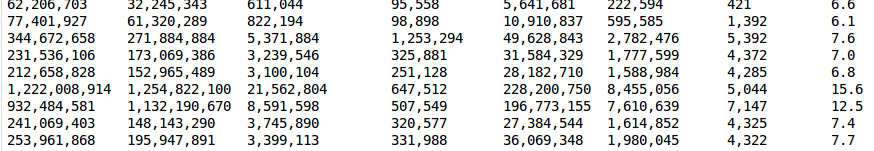
以下是我的原始数据的前几行供引用:
cycles         instructions   cache-references  cache-misses  branches     branch-misses  page-faults  Power
62,206,703     32,245,343     611,044           95,558        5,641,681    222,594        421          6.6
77,401,927     61,320,289     822,194           98,898        10,910,837   595,585        1,392        6.1
344,672,658    271,884,884    5,371,884         1,253,294     49,628,843   2,782,476      5,392        7.6
231,536,106    173,069,386    3,239,546         325,881       31,584,329   1,777,599      4,372        7.0
212,658,828    152,965,489    3,100,104         251,128       28,182,710   1,588,984      4,285        6.8
1,222,008,914  1,254,822,100  21,562,804        647,512       228,200,750  8,455,056      5,044        15.6
932,484,581    1,132,190,670  8,591,598         507,549       196,773,155  7,610,639      7,147        12.5
241,069,403    148,143,290    3,745,890         320,577       27,384,544   1,614,852      4,325        7.4
253,961,868    195,947,891    3,399,113         331,988       36,069,348   1,980,045      4,322        7.7
142,030,480    91,300,650     2,026,211         242,980       17,269,376   1,010,190      3,651        6.5
90,317,329     51,421,629     1,309,714         146,585       9,332,184    492,279        1,511        6.2
293,537,472    224,121,684    3,964,357         379,418       41,137,776   1,981,583      3,386        7.9
谢谢
最佳答案
我会使用 pandas 将数据读入内存,否则只需按照您在波士顿房价中找到的示例即可:
import pandas as pd
import statsmodels.api as sm

df = pd.read_csv('data.txt', sep='\s+', thousands=',')
X = df.loc[:, 'cycles':'page-faults']
y = df['Power']
model = sm.OLS(y, X).fit()
在这种情况下,model.summary() 变为
OLS Regression Results
==============================================================================
Dep. Variable:                  Power   R-squared:                       0.972
Model:                            OLS   Adj. R-squared:                  0.932
Method:                 Least Squares   F-statistic:                     24.56
Date:                Fri, 10 Nov 2017   Prob (F-statistic):            0.00139
Time:                        22:09:47   Log-Likelihood:                -21.470
No. Observations:                  12   AIC:                             56.94
Df Residuals:                       5   BIC:                             60.33
Df Model:                           7
Covariance Type:            nonrobust
====================================================================================
                       coef    std err          t      P>|t|      [0.025      0.975]
------------------------------------------------------------------------------------
cycles            1.287e-07   5.11e-08      2.518      0.053   -2.66e-09     2.6e-07
instructions     -7.083e-09   4.21e-07     -0.017      0.987   -1.09e-06    1.07e-06
cache-references -1.625e-06   2.48e-06     -0.656      0.541   -7.99e-06    4.74e-06
cache-misses      3.222e-06   5.24e-06      0.615      0.566   -1.03e-05    1.67e-05
branches          1.281e-07    2.6e-06      0.049      0.963   -6.55e-06    6.81e-06
branch-misses    -1.625e-05    1.2e-05     -1.357      0.233    -4.7e-05    1.45e-05
page-faults          0.0016      0.002      0.924      0.398      -0.003       0.006
==============================================================================
Omnibus:                        2.485   Durbin-Watson:                   1.641
Prob(Omnibus):                  0.289   Jarque-Bera (JB):                0.787
Skew:                           0.606   Prob(JB):                        0.675
Kurtosis:                       3.326   Cond. No.                     1.92e+06
==============================================================================

Warnings:
[1] Standard Errors assume that the covariance matrix of the errors is correctly specified.
[2] The condition number is large, 1.92e+06. This might indicate that there are
strong multicollinearity or other numerical problems.'
关于python - 设置 Statsmodels 线性回归的数据格式,我们在Stack Overflow上找到一个类似的问题: https://stackoverflow.com/questions/47230345/