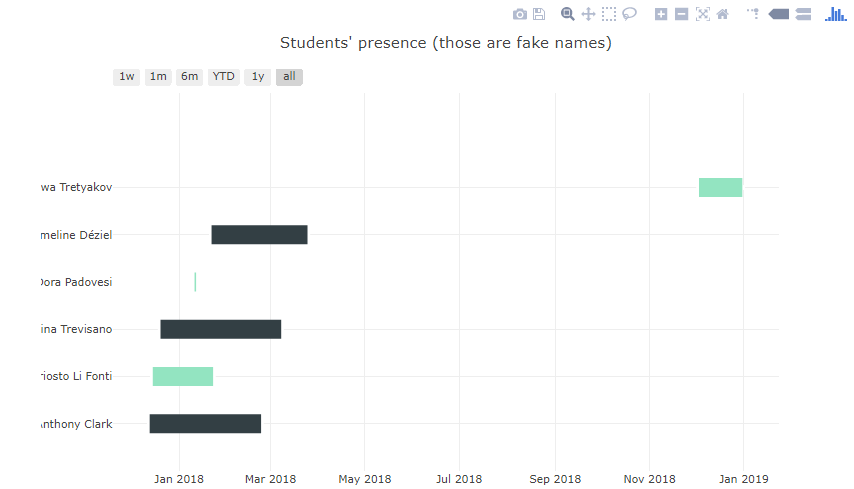
我正在尝试使用plotly库,并在jupyter中制作了一个甘特图,其中包含虚假的学生名单以及他们进入/退出语言学校的时间。
create_gantt 方法正确解释了数据,但显示内容以某种方式在左侧被裁剪。仅显示全名中的 11 个字符左右。
如果你仔细观察页面https://plot.ly/python/gantt/在“Out[7]:”中,任务“Morning Sleep”的 M 也被裁剪。
我发现方法中没有参数可以更改此设置。我还尝试修改 jupyter 的显示属性,它没有影响图表:
from IPython.core.display import display, HTML
display(HTML("<style>.container { width:100%; }</style>"))
有人有办法解决这个问题吗?非常感谢您:)。
代码如下:
import pandas as pd
from plotly.offline import init_notebook_mode, iplot
from plotly.graph_objs import *
init_notebook_mode(connected=True)  # initiate notebook for offline plot
import plotly.figure_factory as ff

df_gantt2 =pd.DataFrame([
{'Task': 'Anthony Clark', 'Start': '2017-12-13', 'Finish': '2018-02-23'},
{'Task': 'Ariosto Li Fonti', 'Start': '2017-12-15', 'Finish': '2018-01-23'},
{'Task': 'Cettina Trevisano', 'Start': '2017-12-20', 'Finish': '2018-03-08'},
{'Task': 'Dora Padovesi', 'Start': '2018-01-11', 'Finish': '2018-01-12'},
{'Task': 'Emmeline Déziel', 'Start': '2018-01-22', 'Finish': '2018-03-25'},
{'Task': 'Sawa Tretyakov', 'Start': '2018-12-03', 'Finish': '2018-12-31'},])

fig = ff.create_gantt(df_gantt2, colors=['#333F44', '#93e4c1'],title='Students\' presence (those are fake names)',show_colorbar=True, bar_width=0.2, showgrid_x=True, showgrid_y=True)
iplot(fig,filename = 'students-presence-gantt')
最佳答案
所以我发现有一个关于plotly的论坛,并且有人在那里回答了( https://community.plot.ly/t/gantt-cropped-text/7053/3 )。
我设法以编程方式解决了这个问题。我使用函数计算任务列的最大宽度(以像素为单位)。创建图表后,我使用 uptade 方法并给出最大宽度作为参数。然后我显示图表。
def max_length_col(column,font='OpenSans-Regular.ttf', font_size=14):
'''Calculates the max length of a column of a dataframe / a panda serie in pixels.
Default keyword arguments values are useful to adapt the length of the y axis of a plotly gantt chart.

Args:
    column: panda serie
    font: ttf filename (look under ...\Windows\Font, get the exact name by right-clicking on a ttf file and then go to properties)
    font_size : font size as an int

Example:
    In:
        df_gantt =pd.DataFrame([
        {'Task': 'Anthony Clark', 'Start': '2017-12-13', 'Finish': '2018-02-23'},
        {'Task': 'Ariosto Li Fonti', 'Start': '2017-12-15', 'Finish': '2018-01-23'},
        {'Task': 'Cettina Trevisano', 'Start': '2017-12-20', 'Finish': '2018-03-08'}])
        column_len = max_length_col(df_gantt['Task'])
        print(column_len)
    Out:
        117

Returns:
    Length of the column in pixel as an int
'''
from PIL import ImageFont #pip install pillow
font = ImageFont.truetype(font,font_size) # should already be installed, if not download it and save under Windows/Font
length_list = []
for row in range(len(column)):
    text = str(column[row])
    size = font.getsize(text)
    length_list.append(size[0]) # append length in pixel (size[1] for heigth)
max_length_px = max(length_list)
return max_length_px

import pandas as pd
from plotly.offline import init_notebook_mode, iplot
from plotly.graph_objs import *
init_notebook_mode(connected=True)  # initiate notebook for offline plot
import plotly.figure_factory as ff

df_gantt2 =pd.DataFrame([
{'Task': 'Anthony Clark', 'Start': '2017-12-13', 'Finish': '2018-02-23'},
{'Task': 'Ariosto Li Fonti', 'Start': '2017-12-15', 'Finish': '2018-01-23'},
{'Task': 'Cettina Trevisano', 'Start': '2017-12-20', 'Finish': '2018-03-08'},
{'Task': 'Dora Padovesi', 'Start': '2018-01-11', 'Finish': '2018-01-12'},
{'Task': 'Emmeline Déziel', 'Start': '2018-01-22', 'Finish': '2018-03-25'},
{'Task': 'Sawa Tretyakov', 'Start': '2018-12-03', 'Finish': '2018-12-31'},])

fig = ff.create_gantt(df_gantt2, colors=['#333F44', '#93e4c1'],title='Students\' presence (those are fake names)',show_colorbar=True, bar_width=0.2, showgrid_x=True, showgrid_y=True)

column_len = df_gantt2['Task']
max_length_px = max_length_col(column_len)

fig['layout'].update(autosize=False, width=800, height=500, margin=dict(l=max_length_px))
#Insert this line just after fig=ff.create_gantt
iplot(fig,filename = 'students-presence-gantt')
关于python - 甘特图的显示问题(Jupyter、Plotly、Python),我们在Stack Overflow上找到一个类似的问题: https://stackoverflow.com/questions/47516276/