我想创建一个动画图表,其参数可以通过 slider 和其他小部件进行控制。我必须创建几个类似的图形,所以我想将其打包在某个类中,以便与各种参数一起重用。但在此之前,我想弄清楚它是如何工作的。
此代码将在图的上部创建一个图表,并将其余部分留空。但是,x 轴和 y 轴在 [-0.05,0.05] 范围内绘制,而不是在下面的预定义范围内绘制。
如何确保图表按照我想要的比例绘制?
我不知道的另一件事是如何将小部件添加到布局中?我想将它们插入到 gridspec 中,而不需要对坐标和大小进行硬编码,以使它们调整到给定的空间。
我尝试了下面的方法,但这显然不起作用。 我该如何处理才能使其按我想要的方式工作?
import matplotlib.gridspec as gridspec
import numpy as np

from matplotlib import pyplot as plt

PI = np.pi

# Half width of the graph x-axis
x_axis = 4*PI
# x_axis offset
x_offset = 0
# Half height of the graph y-axis
y_axis = 8
# y_axis offset
y_offset = -1

fig = plt.figure()

mainGrid = gridspec.GridSpec(2, 1)
graphCell = plt.subplot(mainGrid[0, :])
graphCell.plot(xlim=(-x_axis-x_offset, x_axis-x_offset), ylim=(-y_axis-y_offset, y_axis-y_offset))
controlCell = mainGrid[1, :]
controlGrid = gridspec.GridSpecFromSubplotSpec(1, 7, controlCell)
sliderCell = controlGrid[0, 0]
sliderCount = 7
sliderGrid = gridspec.GridSpecFromSubplotSpec(sliderCount, 1, sliderCell)
sliders = []
for i in range(0, sliderCount):
    pass
    #sliders[i] = Slider(sliderGrid[0, i], "Test {}".format(i), 0.1, 8.0, valinit=2, valstep=0.01)

x_data = np.linspace(-x_axis-x_offset, x_axis-x_offset, 512)
y_data = [x for x in x_data]

line = plt.plot([], [])[0]
line.set_data(x_data, y_data)

plt.show()
最佳答案
一些问题:
plot没有任何xlim参数。- 代码中的一个网格过多
- 小部件需要位于轴内
- 网格的第一个索引是行,而不是列。
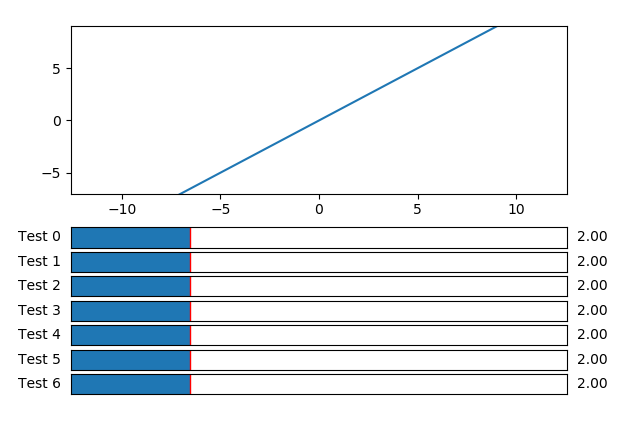
总共
import numpy as np
import matplotlib.pyplot as plt
import matplotlib.gridspec as gridspec
from matplotlib.widgets import Slider

# Half width of the graph x-axis
x_axis = 4*np.pi
# x_axis offset
x_offset = 0
# Half height of the graph y-axis
y_axis = 8
# y_axis offset
y_offset = -1

fig = plt.figure()

mainGrid = gridspec.GridSpec(2, 1)
ax = plt.subplot(mainGrid[0, :])
ax.set(xlim=(-x_axis-x_offset, x_axis-x_offset), ylim=(-y_axis-y_offset, y_axis-y_offset))
controlCell = mainGrid[1, :]

sliderCount = 7
sliderGrid = gridspec.GridSpecFromSubplotSpec(sliderCount, 1, controlCell)
sliders = []
for i in range(0, sliderCount):
    sliderax = plt.subplot(sliderGrid[i, 0])
    slider = Slider(sliderax, "Test {}".format(i), 0.1, 8.0, valinit=2, valstep=0.01)
    sliders.append(slider)

x_data = np.linspace(-x_axis-x_offset, x_axis-x_offset, 512)
y_data = [x for x in x_data]

line = ax.plot([], [])[0]
line.set_data(x_data, y_data)

plt.show()
关于python - 创建一个图形,其中包含按 gridspec 布局排列的绘图、 slider 和其他小部件,我们在Stack Overflow上找到一个类似的问题: https://stackoverflow.com/questions/53761134/