我有 3 个 numpy 数组,其中包含长、纬度和雨量值:
[-7.4989786799999996, -7.5215012000000003, -7.4764561599999997, -7.4989786799999996, -7.5215012000000003, -7.4764561599999997]

[41.90415308, 41.90415308, 41.90415308, 41.881630559999998, 41.881630559999998, 41.881630559999998]

[0.020928397800000002, 0.0299166963, 0.0171956848, 0.0340920761, 0.0429551788, 0.0301877651]
Scipy 插值需要 1 个具有 3 个不同 Lons 的数组,另一个具有 2 个不同 Lons 的数组和一个 3x2 降雨值数组。我怎样才能 reshape 它们?
最佳答案
听起来您想要进行 2D 插值。
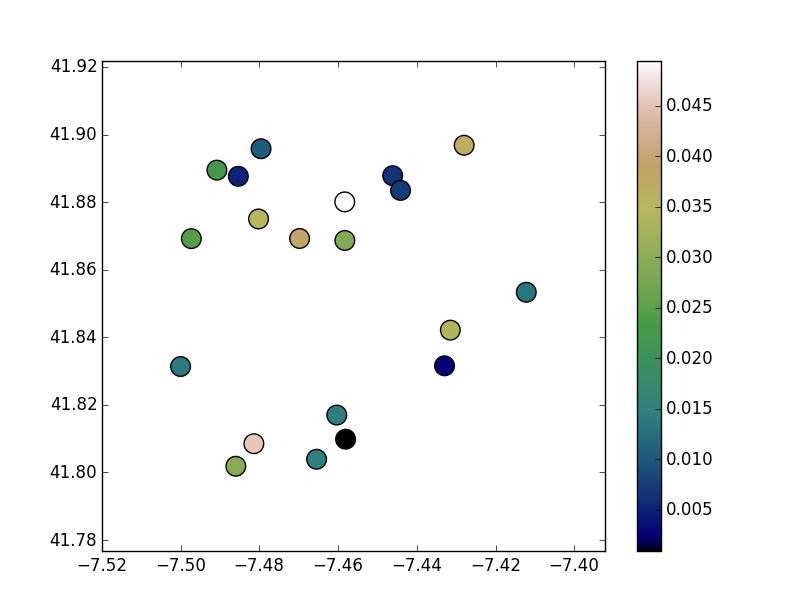
例如,让我们使用一些与您类似的随机数据并将其绘制出来:
import numpy as np
import matplotlib.pyplot as plt
np.random.seed(1) # Make example exactly reproducable

num_points = 20
lon = 0.1 * np.random.random(num_points) - 7.5
lat = 0.1 * np.random.random(num_points) + 41.8
z = 0.05 * np.random.random(num_points)

fig, ax = plt.subplots()
artist = ax.scatter(lon, lat, c=z, s=200, cmap='gist_earth')
fig.colorbar(artist)
ax.axis('tight')
plt.show()
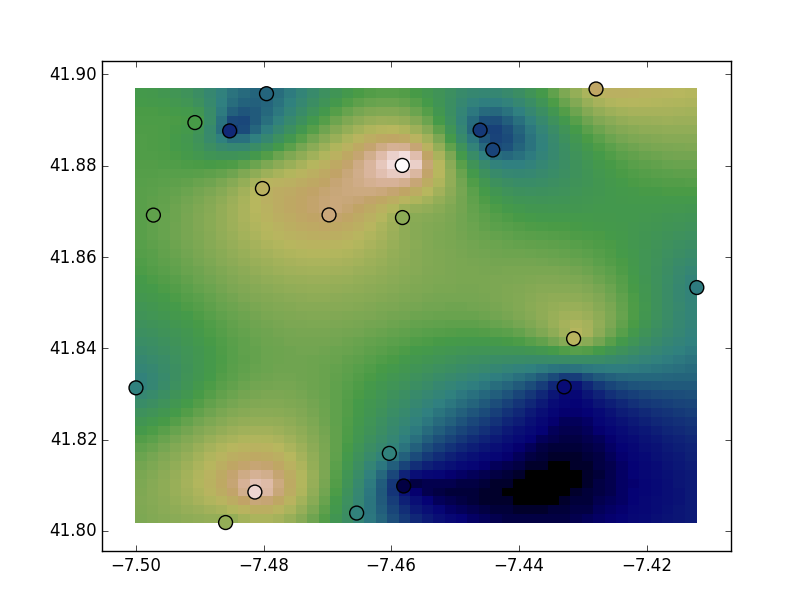
import scipy.interpolate

interp = scipy.interpolate.Rbf(lon, lat, z, function='linear')

# 20x20 grid of points to interpolate on
yy, xx = np.mgrid[lat.min():lat.max():20j, lon.min():lon.max():20j]

zi = interp(xx, yy)

# Plot the results
fig, ax = plt.subplots()
artist = ax.scatter(lon, lat, c=z, s=100, cmap='gist_earth',
                     vmin=zi.min(), vmax=zi.max())
ax.pcolormesh(xx, yy, zi, cmap='gist_earth')
ax.axis('tight')
plt.show()
关于python - 如何 reshape numpy 数组以与 scipy interpolate 一起使用?,我们在Stack Overflow上找到一个类似的问题: https://stackoverflow.com/questions/35603800/