如果我知道图像的坐标如何变形,我想看看图像如何变形。
例如:这里我画了一个圆
import numpy as np
import matplotlib.pyplot as plt
from math import *

plane_side = 500.0 #arcsec

y_l, x_l, = np.mgrid[-plane_side:plane_side:1000j, -plane_side:plane_side:1000j]

r = np.sqrt(y_l**2 + x_l**2)

indexes1 = np.where(r<150.0)
indexes2 = np.where(r>160.0)

image = r.copy()
image[:,:] = 1.0
image[indexes1] = 0.0
image[indexes2] = 0.0

imgplot = plt.imshow(image,cmap="rainbow")
plt.colorbar()
plt.show()
如果我想像这样变形坐标:
y_c = y_lense**3
x_c = x_lense**2
并且绘制的图像扭曲,我该怎么办?
最佳答案
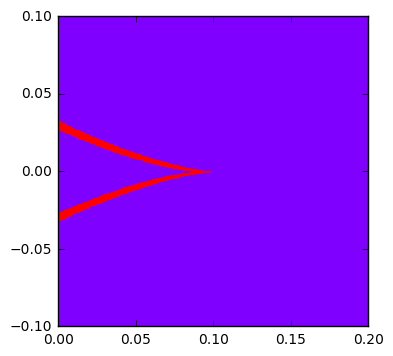
您可以使用plt.pcolormesh():
y_c = (y_l/plane_side)**3
x_c = (x_l/plane_side)**2

ax = plt.gca()
ax.set_aspect("equal")
plt.pcolormesh(x_c, y_c, image, cmap="rainbow")
ax.set_xlim(0, 0.2)
ax.set_ylim(-0.1, 0.1);
结果:
关于python - 如何使图像变形使坐标变形,我们在Stack Overflow上找到一个类似的问题: https://stackoverflow.com/questions/39649761/