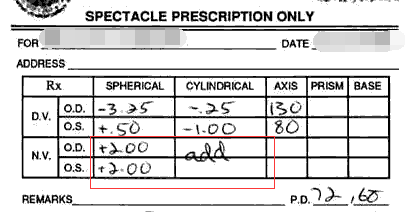
我想训练一个模型来检测图片/pdf 中的眼科处方数据。前任。 prescription
我正在考虑将任务分成 2 个:
- 定义/训练一个模型来检测图片上表格的位置。
- 定义/训练一个模型,该模型将根据先前模型的结果预测数据。
我被困在第一个模型上。我首先创建 100k 图像(例如 /image/CQJXE.png 、 /image/iJHuk.png ),其中包含表格,并将表格坐标作为标签。 标签示例:
27.38       // top coordinate of 1 table in picture
172.00      // left coordinate of 1 table
459.62      // right coordinate of 1 table
311.00      // bottom coordinate of 1 table
4.00        // number of columns of 1 table
5.00        // number of rows of 1 table
25.00       // top coordinate of 2 table in picture
424.50      // left coordinate of 2 table
462.00      // right coordinate of 2 table
544.50      // bottom coordinate of 2 table
7.00        // number of columns of 2 table
2.00        // number of rows of 2 table
准备数据
X:
    image = tf.image.decode_png(image_string, channels=3)
    image = tf.image.resize(image,(337, 238), method=tf.image.ResizeMethod.NEAREST_NEIGHBOR)
    image = tf.image.rgb_to_grayscale(image,name=None)
    image = tf.image.convert_image_dtype(image, dtype=tf.uint16, saturate=False)
    image_string = tf.image.encode_png(   image ,    compression=-1,    name=None)
    image_string = image_string.numpy()
    image_shape = image.shape
是:
我只是将坐标乘以 0.4(因为我将图像大小调整为 40%),生成标签中的其他数据保留为 0(至少目前,期望仅预测坐标)重复 5 次,因为可能只有图中有 5 张 table 。
例如:
0.6120000000000001, 24.400000000000002, 193.284, 65.60000000000001, 0, 0, 2.8920000000000003, 97.60000000000001, 189.784, 144.0, 0, 0, 0.0, 0.0, 0.0, 0.0, 0.0, 0.0, 0.0, 0.0, 0.0, 0.0, 0.0, 0.0, 0.0, 0.0, 0.0, 0.0, 0.0, 0.0
训练:
创建数据集:
def parseExample(example):
    features = {
        "image": tf.io.FixedLenFeature([], tf.string),
        "output": tf.io.VarLenFeature(dtype=tf.float32),
        # "output": tf.io.FixedLenFeature([], tf.float32),
        'height': tf.io.FixedLenFeature([], tf.int64),
        'width': tf.io.FixedLenFeature([], tf.int64),
        'depth': tf.io.FixedLenFeature([], tf.int64),
        'name': tf.io.FixedLenFeature([], tf.string)
    }
    parsed = tf.io.parse_single_example(example, features=features)
    image = tf.image.decode_png(parsed['image'], channels=1)
    image = tf.reshape(image,  (parsed['height'], parsed['width'], parsed['depth']))
    label = parsed["output"]
    return image, label.values

def make_dataset(dir, dtype, dataSetType, parse_fn):
  dataset = tf.data.TFRecordDataset(tf.data.Dataset.list_files("{}\\{}_{}_*.tfrecord".format(args.records_dir,dataSetType, dtype )))
  dataset = dataset.shuffle(buffer_size=1000)
  dataset = dataset.map(parse_fn)
  dataset = dataset.batch(batch_size=32)
  dataset.cache('E:\\trainingcache')
  return dataset
型号: 经过大量尝试不同的层/激活/优化器/损失后,这就是最好的结果。
def getTableModel(shape):
    model = tf.keras.Sequential([
        tf.keras.layers.Conv2D(256,3,3, padding='valid',activation='relu', dilation_rate=(1, 1), use_bias=True, kernel_initializer='glorot_uniform', bias_initializer='zeros', input_shape= shape),
        tf.keras.layers.Conv2D(128,3,3, activation='relu'),
        tf.keras.layers.MaxPooling2D(pool_size=(2, 2)),
        tf.keras.layers.Flatten(),
        tf.keras.layers.Dense(256, activation='relu'),
        tf.keras.layers.Dropout(0.5),
        tf.keras.layers.Dense(128, activation='relu'),
        tf.keras.layers.Dense(64, activation='relu'),
        tf.keras.layers.Dense(30, activation='relu', kernel_initializer='normal')
    ])

    optimizer = tf.keras.optimizers.Adam(learning_rate=0.01, amsgrad=True)

    model.compile(loss='categorical_crossentropy',
                optimizer=optimizer,
                metrics=['mse', 'mae','acc'])
    return model
培训:
def train(model, train,  cppath):
    EPOCHS = 1000
    cbs = [PrintDot()]
    checkpointcb = tf.keras.callbacks.ModelCheckpoint(filepath=cppath,
                                                 save_weights_only=True,
                                                 verbose=1, period=100)


    print(model.summary())
    # The patience parameter is the amount of epochs to check for improvement
    early_stop = keras.callbacks.EarlyStopping(monitor='val_loss', patience=10)
    history = model.fit(train, epochs=EPOCHS, verbose=0, callbacks=[PrintDot(), checkpointcb])
我错过了什么或做错了什么?因为我获得的最佳准确度是 ~0.7
训练和测试后的输出:
625/625 [==============================] - 20s 32ms/step - loss: 1620.7100 - mse: 110371661623007769526272.0000 - mae: 133217427456.0000 - acc: 0.7244 test loss, test acc: [1620.709959765625, 1.1037166e+23, 133217430000.0, 0.7244]
测试 1 预测:
Prediction:
[8.52919688e+12 2.94164575e+13 1.72934342e+14 6.60441483e+13 0.00000000e+00 0.00000000e+00 0.00000000e+00 8.95260683e+13 1.73240895e+14 1.32049206e+14 0.00000000e+00 0.00000000e+00 0.00000000e+00 0.00000000e+00 0.00000000e+00 0.00000000e+00 0.00000000e+00 0.00000000e+00 0.00000000e+00 0.00000000e+00 0.00000000e+00 0.00000000e+00 0.00000000e+00 0.00000000e+00 0.00000000e+00 0.00000000e+00 0.00000000e+00 0.00000000e+00 0.00000000e+00 0.00000000e+00]
Actual label
[-0.6120000000000001, 24.400000000000002, 193.284, 65.60000000000001, 0, 0, 2.8920000000000003, 97.60000000000001, 189.784, 144.0, 0, 0, 0.0, 0.0, 0.0, 0.0, 0.0, 0.0, 0.0, 0.0, 0.0, 0.0, 0.0, 0.0, 0.0, 0.0, 0.0, 0.0, 0.0, 0.0]
最佳答案
导致模型陷入局部最小值(如果是的话)的原因有很多。
您可以尝试将学习率从 0.01 降低到 0.001。
尝试绘制损失/加速曲线以查看模型是否已收敛。
尝试使用全局平均池化而不是展平
您还尝试过使用 transfer learning
关于python - 检测图片中表格的模型,我们在Stack Overflow上找到一个类似的问题: https://stackoverflow.com/questions/59361117/