我使用以下代码可视化 RandomForestClassifier 的结果:
X, y = make_blobs(n_samples=300, centers=4,
                         random_state=0, cluster_std=1.0)

def visualize_classifier(model, X, y, ax=None, cmap='rainbow'):
    ax = ax or plt.gca()
    # Plot the training points
    ax.scatter(X[:, 0], X[:, 1], c=y, s=30, cmap=cmap,
               clim=(y.min(), y.max()), zorder=3)
    ax.axis('tight')
    ax.axis('off')
    xlim = ax.get_xlim()
    ylim = ax.get_ylim()
    # fit the estimator
    model.fit(X, y)
    xx, yy = np.meshgrid(np.linspace(*xlim, num=200),
                         np.linspace(*ylim, num=200))
    Z = model.predict(np.c_[xx.ravel(), yy.ravel()]).reshape(xx.shape)
    # Create a color plot with the results
    n_classes = len(np.unique(y))
    contours = ax.contourf(xx, yy, Z, alpha=0.3,
                           levels=np.arange(n_classes + 1) - 0.5,
                           cmap=cmap, clim=(y.min(), y.max()),
                           zorder=1)
    ax.set(xlim=xlim, ylim=ylim)

tree = DecisionTreeClassifier()
bag = BaggingClassifier(tree, n_estimators=100, max_samples=0.8, random_state=1)
bag.fit(X, y)
visualize_classifier(bag, X, y)

我注意到,这些区域的某些边界包含不同的颜色。
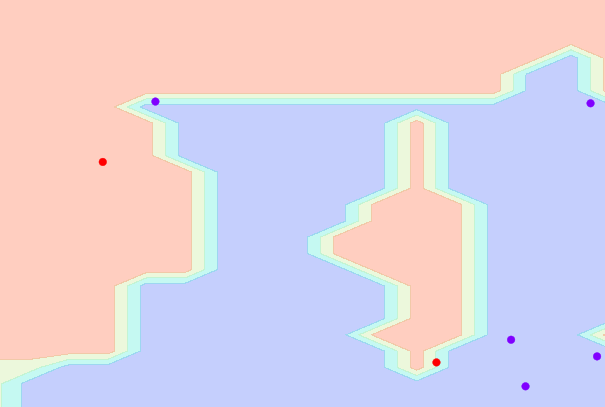
我很确定这种行为与我使用的数据无关,但有一些数学/图形背景......那么这种误传的原因是什么?
最佳答案
当我尝试预测边界上的点时,它给了我合理的预测(即与边界附近的两个大区域之一相关的预测),而不是与边界颜色相关的预测。
因此我猜测边框颜色不同的原因是边框没有在网格中表示(即网格中没有点正好落在边框上),而边框的两侧在网格中表示网格,因此可视化工具不知道什么应该是正确的颜色。
如果你切换
xx, yy = np.meshgrid(np.linspace(*xlim, num=200),
                         np.linspace(*ylim, num=200))
进入
xx, yy = np.meshgrid(np.linspace(*xlim, num=2000),
                         np.linspace(*ylim, num=2000))
(即,增加 200 到 2000。请注意,代码速度较慢,因为在这种情况下需要一段时间才能生成分类),您会得到更准确的数字,并且重叠边框的许多部分会消失。
关于python - RandomForestClassifier 可视化 - 重叠颜色,我们在Stack Overflow上找到一个类似的问题: https://stackoverflow.com/questions/45189276/