大家好!我被要求在 R 上创建一个 K 均值算法,但我并不真正了解这门语言,所以我在互联网上找到了一些示例代码,并决定使用。我研究了它,了解了其中使用的功能,并对其进行了一些修正,因为它运行得不太好。代码如下:
# Creating a sample of data
y=rnorm(500,1.65)
x=rnorm(500,1.15)
x=cbind(x,y)
centers <- x[sample(nrow(x),5),]

# A function for calculating the distance between centers and the rest of the dots
euclid <- function(points1, points2) {
  distanceMatrix <- matrix(NA, nrow=dim(points1)[1], ncol=dim(points2)[1])
  for(i in 1:nrow(points2)) {
    distanceMatrix[,i] <- sqrt(rowSums(t(t(points1)-points2[i,])^2))
  }
  distanceMatrix
}


# A method function
K_means <- function(x, centers, euclid, nItter) {
  clusterHistory <- vector(nItter, mode="list")
  centerHistory <- vector(nItter, mode="list")

  for(i in 1:nItter) {
    distsToCenters <- euclid(x, centers)
    clusters <- apply(distsToCenters, 1, which.min)
    centers <- apply(x, 2, tapply, clusters, mean)
    # Saving history
    clusterHistory[[i]] <- clusters
    centerHistory[[i]] <- centers
  }

  structure(list(clusters = clusterHistory, centers = centerHistory))

}


res <- K_means(x, centers, euclid, 5)
#To use the same plot operations I had to use unlist, since the resulting object in my function is a list of lists,
#and default object is just a list. And also i store the history of each iteration in that object.
res <- unlist(res, recursive = FALSE)
plot(x, col = res$clusters5)
points(res$centers5, col = 1:5, pch = 8, cex = 2)
它在这个简单的矩阵上运行良好。但有人要求我在 iris 上使用它:
head(iris)
a <-data.frame(iris$Sepal.Length, iris$Sepal.Width, iris$Petal.Length, iris$Petal.Width)
centers <- a[sample(nrow(a),3),]
iris_clusters <- K_means(a, centers, euclid, 3)
iris_clusters <- unlist(iris_clusters, recursive = FALSE)
head(iris_clusters)
问题是它不起作用。错误是:
Error in distanceMatrix[, i] <- sqrt(rowSums(t(t(points1) - points2[i,  :
  number of items to replace is not a multiple of replacement length
我知道物体的尺寸不匹配,但我不明白为什么。这就是我寻求帮助的原因。我提前对这段代码中可能存在的所有愚蠢之处表示歉意,但我还不太熟悉这门语言,所以不要对我评价太严厉。谢谢!
最佳答案
您的实现应该适用于简单的类型转换
iris_clusters <- K_means(as.matrix(a), as.matrix(centers), euclid, 3) # 3 iterations
iris_clusters <- unlist(iris_clusters, recursive = FALSE)
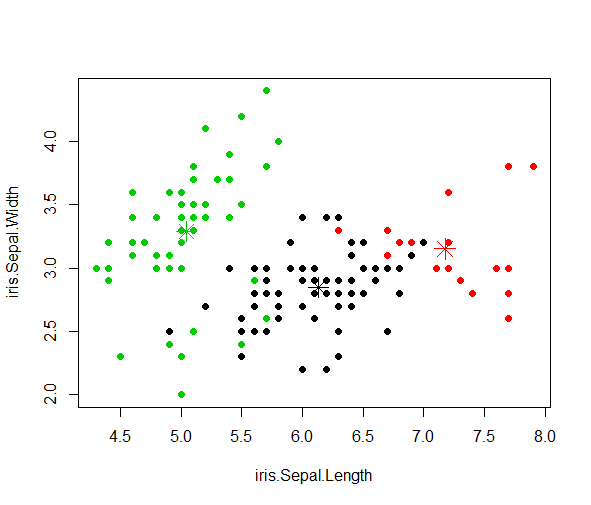
# plotting the clusters obtained on the first two dimensions at the end of 3rd iteration
plot(a[,1:2], col = iris_clusters$clusters3, pch=19)
points(iris_clusters$centers3, col = 1:5, pch = 8, cex = 2)
head(iris_clusters)

# cluster assignments and centroids computed at different iterations

$clusters1
  [1] 3 3 3 3 3 3 3 3 3 3 3 3 3 3 3 3 3 3 3 3 3 3 3 3 3 3 3 3 3 3 3 3 3 3 3 3 3 3 3 3 3 3 3 3 3 3 3 3 3 3 2 2 2 3 2 3 2 3 2 3 3 3 3 2 3 3 3 3 3 3 2 3 2 2 3 3
 [77] 2 2 3 3 3 3 3 2 3 3 2 3 3 3 3 2 3 3 3 3 3 3 3 3 1 2 1 2 1 1 3 1 1 1 2 2 2 2 2 2 2 1 1 2 1 2 1 2 1 1 2 2 2 1 1 1 2 2 2 1 2 2 2 2 1 2 2 1 1 2 2 2 2 2

$clusters2
  [1] 3 3 3 3 3 3 3 3 3 3 3 3 3 3 3 3 3 3 3 3 3 3 3 3 3 3 3 3 3 3 3 3 3 3 3 3 3 3 3 3 3 3 3 3 3 3 3 3 3 3 2 2 2 2 2 2 2 3 2 3 3 2 2 2 3 2 2 2 2 3 2 2 2 2 2 2
 [77] 2 2 2 3 3 3 2 2 2 2 2 2 2 2 2 2 2 3 2 2 2 2 3 2 1 2 1 2 1 1 2 1 1 1 2 2 1 2 2 2 2 1 1 2 1 2 1 2 1 1 2 2 2 1 1 1 2 2 2 1 2 2 2 1 1 2 2 1 1 2 2 2 2 2

$clusters3
  [1] 3 3 3 3 3 3 3 3 3 3 3 3 3 3 3 3 3 3 3 3 3 3 3 3 3 3 3 3 3 3 3 3 3 3 3 3 3 3 3 3 3 3 3 3 3 3 3 3 3 3 2 2 2 2 2 2 2 3 2 2 2 2 2 2 2 2 2 2 2 2 2 2 2 2 2 2
 [77] 2 2 2 2 2 2 2 2 2 2 2 2 2 2 2 2 2 3 2 2 2 2 3 2 1 2 1 2 1 1 2 1 1 1 2 2 1 2 2 2 2 1 1 2 1 2 1 2 1 1 2 2 1 1 1 1 1 2 2 1 1 2 2 1 1 1 2 1 1 1 2 2 2 2

$centers1
  iris.Sepal.Length iris.Sepal.Width iris.Petal.Length iris.Petal.Width
1          7.150000         3.120000          6.090000        2.1350000
2          6.315909         2.915909          5.059091        1.8000000
3          5.297674         3.115116          2.550000        0.6744186

$centers2
  iris.Sepal.Length iris.Sepal.Width iris.Petal.Length iris.Petal.Width
1          7.122727         3.113636          6.031818        2.1318182
2          6.123529         2.852941          4.741176        1.6132353
3          5.056667         3.268333          1.810000        0.3883333

$centers3
  iris.Sepal.Length iris.Sepal.Width iris.Petal.Length iris.Petal.Width
1          7.014815         3.096296          5.918519         2.155556
2          6.025714         2.805714          4.588571         1.518571
3          5.005660         3.369811          1.560377         0.290566
关于r - K-均值算法,R,我们在Stack Overflow上找到一个类似的问题: https://stackoverflow.com/questions/40979777/