以下代码取自 @adibender 对“一张图 ROCR 中的多个 ROC 曲线”的回答。代码部分来自?plot.performance。
library(ROCR)
data(ROCR.simple)
preds <- cbind(p1 = ROCR.simple$predictions,
            p2 = abs(ROCR.simple$predictions +
            rnorm(length(ROCR.simple$predictions), 0, 0.1)))

pred.mat <- prediction(preds, labels = matrix(ROCR.simple$labels,
            nrow = length(ROCR.simple$labels), ncol = 2) )

perf.mat <- performance(pred.mat, "tpr", "fpr")
plot(perf.mat)
我想使用 r 包 ROCR 在单个图中说明多个 ROC 曲线,如上面的代码。但是,我希望 ROC 曲线具有不同的颜色。如何为不同的曲线应用不同的颜色?提前致谢。
最佳答案
试试这个(您可以使用ROCR来完成):
library(ROCR)
data(ROCR.simple)
preds <- cbind(p1 = ROCR.simple$predictions,
p2 = abs(ROCR.simple$predictions +
rnorm(length(ROCR.simple$predictions), 0, 0.1)))
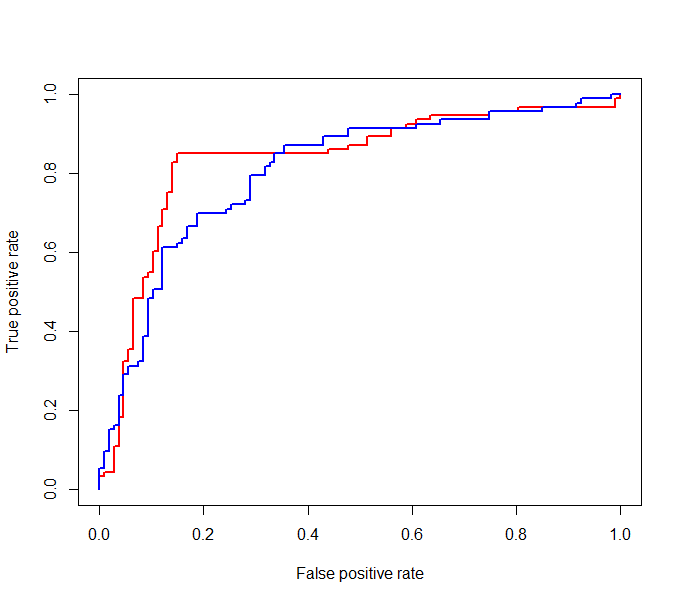
n <- 2 # you have n models
colors <- c('red', 'blue') # 2 colors
for (i in 1:n) {
plot(performance(prediction(preds[,i],ROCR.simple$labels),"tpr","fpr"),
add=(i!=1),col=colors[i],lwd=2)
}
关于R:使用ROCR绘制多条不同颜色的ROC曲线,我们在Stack Overflow上找到一个类似的问题: https://stackoverflow.com/questions/41833071/