我正在使用 JFreeChart 创建折线图,这些折线图可导出为图像并嵌入到自动生成的文档中。例如,一个简单的折线图如下所示:
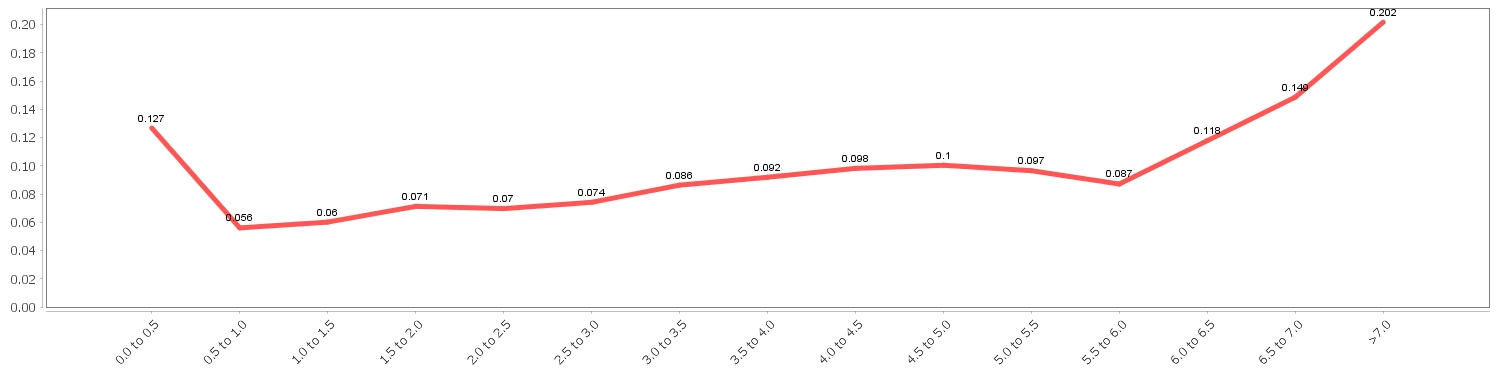
我用来显示值的代码是:
LineAndShapeRenderer renderer = new LineAndShapeRenderer(true, false);
chart.getCategoryPlot().setRenderer(renderer);
renderer.setBaseItemLabelGenerator(new StandardCategoryItemLabelGenerator("{2}", NumberFormat.getNumberInstance()));
renderer.setBaseItemLabelsVisible(true);
我还想添加误差线来显示每个点的标准差,这可以通过使用 StatisticalLineAndShapeRenderer 来完成(当然还要将误差值添加到数据集中),这样上面的 chode 现在就变成了这个:
StatisticalLineAndShapeRenderer renderer = new StatisticalLineAndShapeRenderer(true, false);
chart.getCategoryPlot().setRenderer(renderer);
renderer.setBaseItemLabelGenerator(new StandardCategoryItemLabelGenerator("{2}", NumberFormat.getNumberInstance()));
renderer.setBaseItemLabelsVisible(true);
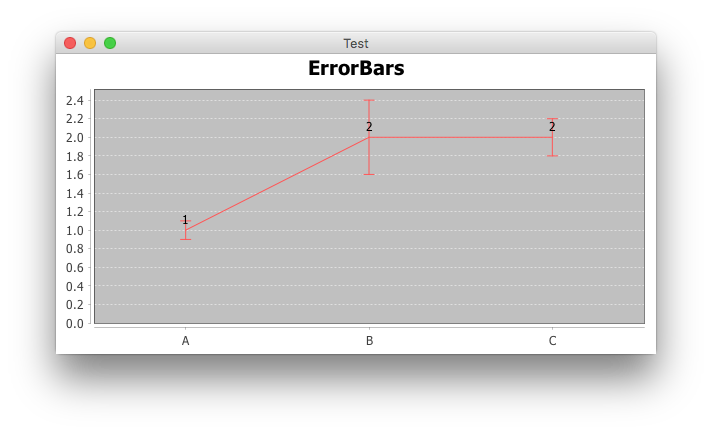
使用此代码,生成的图表带有误差线,但标签已消失。正如此图中所示:
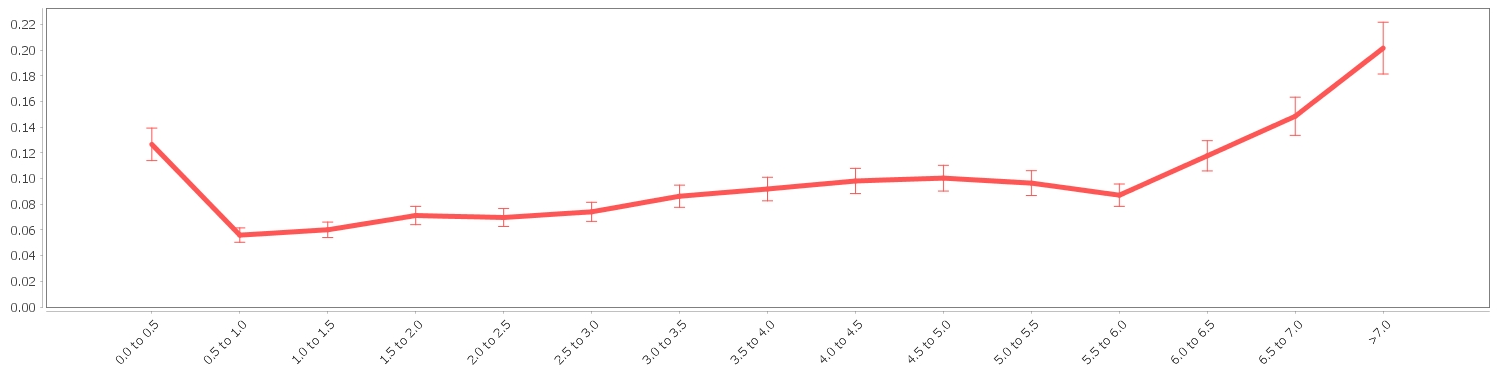
我试图找到一个包含错误栏和标签的在线示例,但我没有找到。为什么使用状态渲染器时标签消失,有什么办法解决这个问题吗?
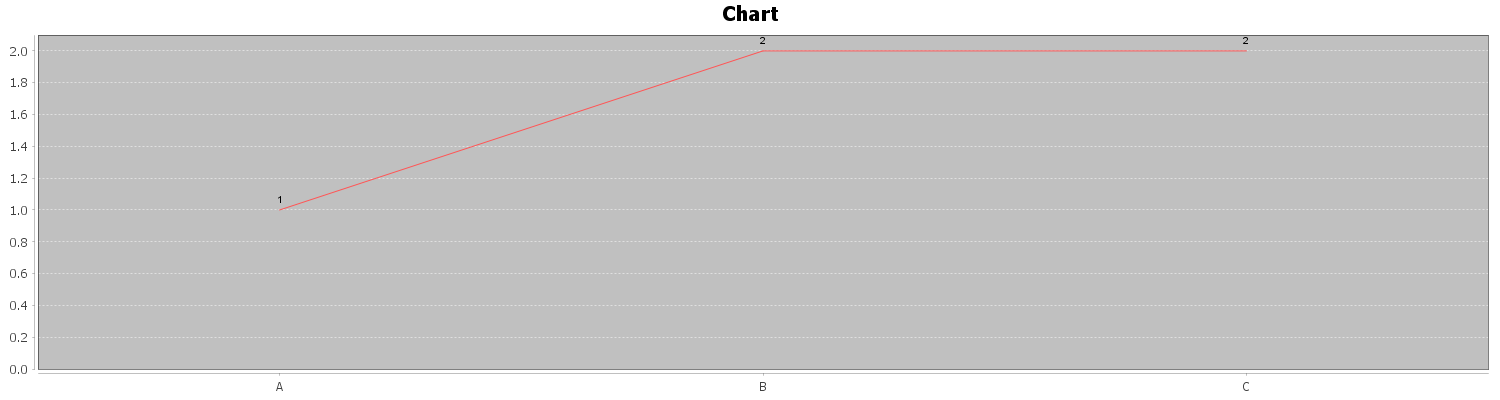
编辑:添加了最小且独立的示例。
DefaultStatisticalCategoryDataset dataset = new DefaultStatisticalCategoryDataset();
dataset.add(1, 0.1, "serie", "A");
dataset.add(2, 0.4, "serie", "B");
dataset.add(2, 0.2, "serie", "C");
JFreeChart chart = ChartFactory.createLineChart("Chart", null, null, dataset, PlotOrientation.VERTICAL, false, true, true);
LineAndShapeRenderer renderer = new LineAndShapeRenderer(true, false);
chart.getCategoryPlot().setRenderer(renderer);
renderer.setBaseItemLabelGenerator(new StandardCategoryItemLabelGenerator("{2}", NumberFormat.getNumberInstance()));
renderer.setBaseItemLabelsVisible(true);
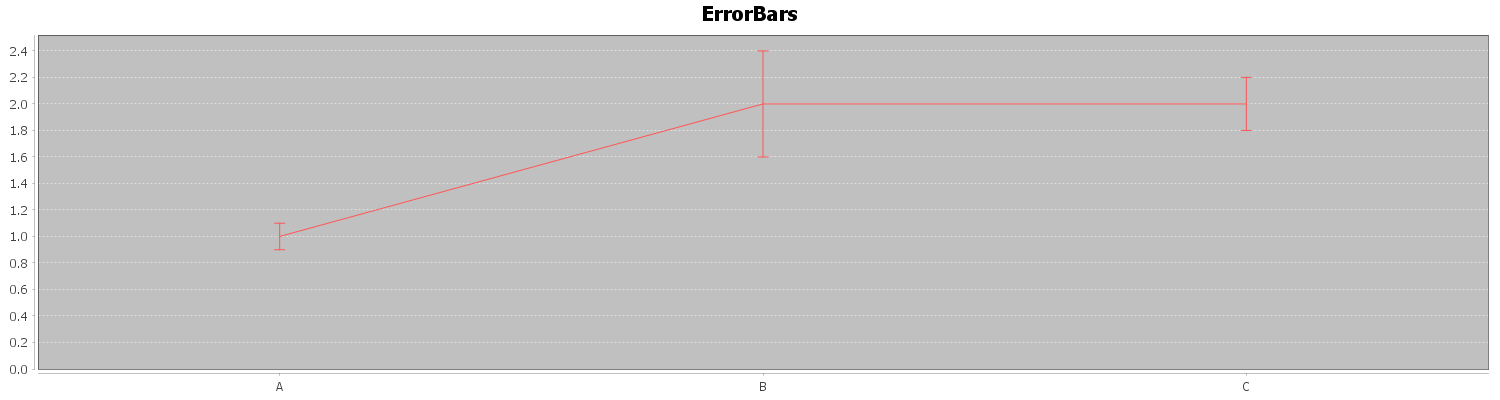
JFreeChart chartErrorBars = ChartFactory.createLineChart("ErrorBars", null, null, dataset, PlotOrientation.VERTICAL, false, true, true);
StatisticalLineAndShapeRenderer statisticalRenderer = new StatisticalLineAndShapeRenderer(true, false);
chartErrorBars.getCategoryPlot().setRenderer(statisticalRenderer);
statisticalRenderer.setBaseItemLabelGenerator(new StandardCategoryItemLabelGenerator("{2}", NumberFormat.getNumberInstance()));
statisticalRenderer.setBaseItemLabelsVisible(true);
int width = 1500;
int height = 400;
try {
FileOutputStream fos = new FileOutputStream(new File("chart.png"));
ByteArrayOutputStream baos = new ByteArrayOutputStream();
ChartUtilities.writeChartAsPNG(baos, chart, width, height);
baos.writeTo(fos);
baos.close();
fos.close();
fos = new FileOutputStream(new File("chartErrorBars.png"));
baos = new ByteArrayOutputStream();
ChartUtilities.writeChartAsPNG(baos, chartErrorBars, width, height);
baos.writeTo(fos);
baos.close();
fos.close();
} catch (IOException e) {
e.printStackTrace();
}
以及该代码生成的两个图像。
最佳答案
StatisticalLineAndShapeRenderer当父 LineAndShapeRenderer 方法 getItemShapeVisible() 返回 true 时显示标签。在下面的示例中,我避开了图表工厂,而是使用了显式的 StatisticalLineAndShapeRenderer 构造函数来启用形状和线条。
StatisticalLineAndShapeRenderer renderer
        = new StatisticalLineAndShapeRenderer(true, true);
Is there any specific reason to avoid the
ChartFactory?
虽然重新利用 ChartFactory 很方便,但它让人想起 ordering chicken on toast, hold the chicken, to get toast 。更关键的是,discarded LineAndShapeRenderer 带有请求的工具提示和 URL 生成器,这可能会让 future 的维护者感到困惑。
Any way to keep the shapes disabled?
正如你suggest ,空的 Shape 是有效的,例如
renderer.setSeriesShape(0, new Rectangle2D.Double(0, 0, 0, 0));
import java.awt.Dimension;
import java.awt.EventQueue;
import java.text.NumberFormat;
import javax.swing.JFrame;
import org.jfree.chart.ChartPanel;
import org.jfree.chart.JFreeChart;
import org.jfree.chart.StandardChartTheme;
import org.jfree.chart.axis.CategoryAxis;
import org.jfree.chart.axis.NumberAxis;
import org.jfree.chart.axis.ValueAxis;
import org.jfree.chart.labels.StandardCategoryItemLabelGenerator;
import org.jfree.chart.plot.CategoryPlot;
import org.jfree.chart.renderer.category.StatisticalLineAndShapeRenderer;
import org.jfree.data.statistics.DefaultStatisticalCategoryDataset;

/**
 * @see https://stackoverflow.com/a/38080778/230513
 */
public class Test {

    private void display() {
        JFrame f = new JFrame("Test");
        f.setDefaultCloseOperation(JFrame.EXIT_ON_CLOSE);

        DefaultStatisticalCategoryDataset dataset
            = new DefaultStatisticalCategoryDataset();
        dataset.add(1, 0.1, "series", "A");
        dataset.add(2, 0.4, "series", "B");
        dataset.add(2, 0.2, "series", "C");

        CategoryAxis domain = new CategoryAxis();
        ValueAxis range = new NumberAxis();
        StatisticalLineAndShapeRenderer renderer
            = new StatisticalLineAndShapeRenderer(true, true);
        CategoryPlot plot = new CategoryPlot(dataset, domain, range, renderer);
        JFreeChart chart = new JFreeChart(
            "ErrorBars", JFreeChart.DEFAULT_TITLE_FONT, plot, false);
        renderer.setBaseItemLabelGenerator(
            new StandardCategoryItemLabelGenerator("{2}",
                NumberFormat.getNumberInstance()));
        renderer.setBaseItemLabelsVisible(true);
        renderer.setSeriesShape(0, new Rectangle2D.Double(0, 0, 0, 0));
        new StandardChartTheme("JFree").apply(chart);
        f.add(new ChartPanel(chart) {
            @Override
            public Dimension getPreferredSize() {
                return new Dimension(600, 300);
            }
        });

        f.pack();
        f.setLocationRelativeTo(null);
        f.setVisible(true);
    }

    public static void main(String[] args) {
        EventQueue.invokeLater(new Test()::display);
    }
}
关于java - 如何向 JFreeChart 折线图添加标签值和误差线?,我们在Stack Overflow上找到一个类似的问题: https://stackoverflow.com/questions/38056237/