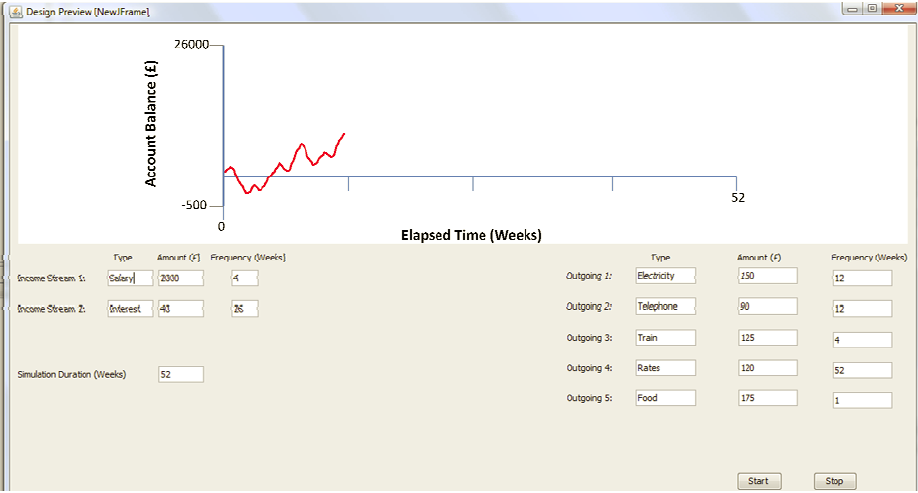
您将如何使用线程的输出创建折线图,这些线程是在 52 秒的时间内运行的传入和传出账单的模拟,这将显示在折线图上,如下所示
我想使用绘图组件,而不是像 JChart 这样的任何第三方类。
最佳答案
假设您有一些用于绘画的 JPanel 对象,我会将以下内容添加到您的对象中:
public class GraphPanel extends JPanel{
    //static constants for defining the size and positioning of the graph on canvas
    //Ignore the values I chose, they were completely random :p
    private static final int X_AXIS_LENGTH = 1000;
    private static final int Y_AXIS_LENGTH = 500;

    private static final int X_AXIS_OFFEST = 50;
    private static final int Y_AXIS_OFFSET = 50;
...
这些都应该是常量值,定义您希望图表在 Canvas 上的大小(轴长度)及其位置(偏移量)。
然后,您可以在 paintComponent 方法中引用这些值,以查找要在 Canvas 上为此更新绘制的线条的实际位置。
...
@Override
public void paintComponent(Graphics g){
    int x, y;
    int prevX, prevY;
    int maxX, maxY;
    ...
    //retrieve values from your model for the declared variables
    ...
    //calculate the coords of your line on the canvas
    int xPos = ((x / maxX) * X_AXIS_LENGTH) + X_AXIS_OFFSET;
    ...
    //do the same for y, prevX, prevY and then you can use g.drawLine
}
...
请注意,您想要更改 maxX 和 maxY,因为 x 和 y 值正在移动到这些值之上限制,您将需要添加一些额外的代码来检查该更改并使用新的限制重新绘制整个图表。
关于java - 使用 Paint 组件绘制折线图,我们在Stack Overflow上找到一个类似的问题: https://stackoverflow.com/questions/9497806/