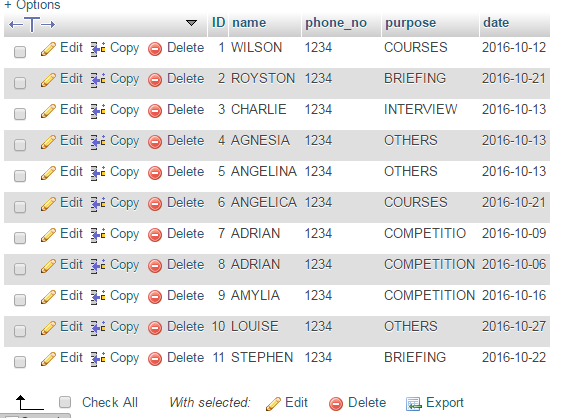
我有这个数据库。我想根据这个数据库生成饼图。饼图将根据 COUNT 函数生成。你能帮我解决这个问题吗?
数据库结构
这里是代码。我的表单的主页。
<?php

mysql_connect("localhost","root","") or die("Error!");
mysql_select_db("try_pie_chart");

?>


<!DOCTYPE html PUBLIC "-//W3C//DTD XHTML 1.0 Transitional//EN"    "http://www.w3.org/TR/xhtml1/DTD/xhtml1-transitional.dtd">
<html xmlns="http://www.w3.org/1999/xhtml">
<head>
<meta http-equiv="Content-Type" content="text/html; charset=utf-8" />
<title>PIE CHART</title>
</head>

<body>

<form name="count" action="piechart_post.php" method="post">


            <select name="month">

 <option value="01">January</option>
 <option value="02">February</option>
 <option value="03">March</option>
 <option value="04">April</option>
 <option value="05">May</option>
 <option value="06">June</option>
 <option value="07">July</option>
 <option value="08">August</option>
 <option value="09">September</option>
 <option value="10">October</option>
 <option value="11">November</option>
 <option value="12">December</option>
 </select>
 <input type="text" name="year" />
 <input type="submit" name="submit" value="Send" onclick = "<?php $month=$_POST['month'] ?><?php $year=$_POST['year'] ?>"/>

 </form>


</body>
</html>
这里是表单操作的代码。它将给出 COUNT 的输出
<?php

mysql_connect("localhost","root","") or die("Error");
mysql_select_db("try_pie_chart");

?>


<html xmlns="http://www.w3.org/1999/xhtml">
<head>
<meta http-equiv="Content-Type" content="text/html; charset=utf-8" />
<title>PIE CHART</title>
</head>

<body>
<?php $month=$_POST['month'] ?><?php $year=$_POST['year'] ?>
<?php
 $result = mysql_query("SELECT COUNT(*) AS total FROM table_details WHERE purpose='COURSES' AND (MONTH(date) LIKE '%$month' AND YEAR(date) LIKE '%$year%')") or die ("Error!");

 $result2 = mysql_query("SELECT COUNT(*) AS total FROM table_details WHERE purpose='BRIEFING' AND (MONTH(date) LIKE '%$month' AND YEAR(date) LIKE '%$year%')") or die ("Error!");

 $result3 = mysql_query("SELECT COUNT(*) AS total FROM table_details WHERE purpose='COMPETITION' AND (MONTH(date) LIKE '%$month' AND YEAR(date) LIKE '%$year%')") or die ("Error!");

 $result4 = mysql_query("SELECT COUNT(*) AS total FROM table_details WHERE purpose='INTERVIEW' AND (MONTH(date) LIKE '%$month' AND YEAR(date) LIKE '%$year%')") or die ("Error!");

$result5 = mysql_query("SELECT COUNT(*) AS total FROM table_details WHERE purpose='OTHERS' AND (MONTH(date) LIKE '%$month' AND YEAR(date) LIKE '%$year%')") or die ("Error!");

$result6 = mysql_query("SELECT COUNT(*) AS total FROM table_details WHERE (MONTH(date) LIKE '%$month' AND YEAR(date) LIKE '%$year%')") or die ("Error!");

?>

 <?php
 $row=mysql_fetch_array($result);
 $row2=mysql_fetch_array($result2);
  $row3=mysql_fetch_array($result3);
 $row4=mysql_fetch_array($result4);
 $row5=mysql_fetch_array($result5);
 $row6=mysql_fetch_array($result6);

 ?>

  <table width="41%" border="1">
  <tr>
  <td width="8%">BIL</td>
  <td width="42%">PURPOSE</td>
  <td width="50%">TOTAL</td>
  </tr>
  <tr>
   <td>1</td>
   <td>COURSES</td>
  <td><?php echo $row['total'];  ?></td>
  </tr>
  <tr>
   <td>2</td>
   <td>BRIEFING</td>
   <td><?php echo $row2['total'];  ?></td>
    </tr>
    <tr>
   <td>3</td>
   <td>COMPETITION</td>
   <td><?php echo $row3['total'];  ?></td>
    </tr>
    <tr>
    <td>4</td>
    <td>INTERVIEW</td>
    <td><?php echo $row4['total'];  ?></td>
    </tr>
    <tr>
    <td>5</td>
    <td>OTHERS</td>
     <td><?php echo $row5['total'];  ?></td>
    </tr>
     <tr>
    <td colspan="2" align="right">Total Overall</td>
    <td><strong><?php echo $row6['total'];  ?></strong></td>
    </tr>
    </table>


     </body>
     </html>
最佳答案
有很多框架可用于使用 php mysql jquery css 创建图表
我在这里列出了其中的一些
http://www.chartjs.org/
https://developers.google.com/chart/
https://d3js.org/
https://gionkunz.github.io/chartist-js/
https://n3-charts.github.io/line-chart/#/home
http://www.highcharts.com/
你可以使用其中一个来满足你的目的,我使用的是chartJs、HighChart和Google Chart,如果你想制作更复杂的图表,那么你也可以选择D3。
我将向您展示如何使用 highchart 创建图表的示例。
$(function () {

    $(document).ready(function () {

        // Build the chart
        $('#container').highcharts({
            chart: {
                plotBackgroundColor: null,
                plotBorderWidth: null,
                plotShadow: false,
                type: 'pie'
            },
            title: {
                text: 'Browser market shares January, 2015 to May, 2015'
            },
            tooltip: {
                pointFormat: '{series.name}: <b>{point.percentage:.1f}%</b>'
            },
            plotOptions: {
                pie: {
                    allowPointSelect: true,
                    cursor: 'pointer',
                    dataLabels: {
                        enabled: false
                    },
                    showInLegend: true
                }
            },
            series: [{
                name: 'Brands',
                colorByPoint: true,
                data: [{
                    name: 'Microsoft Internet Explorer',
                    y: 56.33
                }, {
                    name: 'Chrome',
                    y: 24.03
                }, {
                    name: 'Firefox',
                    y: 10.38
                }, {
                    name: 'Safari',
                    y: 4.77
                }, {
                    name: 'Opera',
                    y: 0.91
                }, {
                    name: 'Proprietary or Undetectable',
                    y: 0.2
                }]
            }]
        });
    });
});
<script src="https://ajax.googleapis.com/ajax/libs/jquery/3.1.0/jquery.min.js"></script>
<script src="https://code.highcharts.com/highcharts.js"></script>
<script src="https://code.highcharts.com/modules/exporting.js"></script>
<div id="container" style="min-width: 310px; height: 400px; max-width: 600px; margin: 0 auto"></div>这里我通过了data作为 json 数组
[{
   name: 'Microsoft Internet Explorer',
   y: 56.33
}, {
    name: 'Chrome',
    y: 24.03
}, {
    name: 'Firefox',
    y: 10.38
}, {
    name: 'Safari',
    y: 4.77
}, {
    name: 'Opera',
    y: 0.91
}, {
    name: 'Proprietary or Undetectable',
    y: 0.2
}]
你可以用你自己的数据替换这个数组,你可以使用json_encode($your_php_array_goes_here)将php数组转换为json它将返回 json 格式的数组。
关于php - 如何基于 COUNT(php + mysql) 创建饼图?,我们在Stack Overflow上找到一个类似的问题: https://stackoverflow.com/questions/40233497/