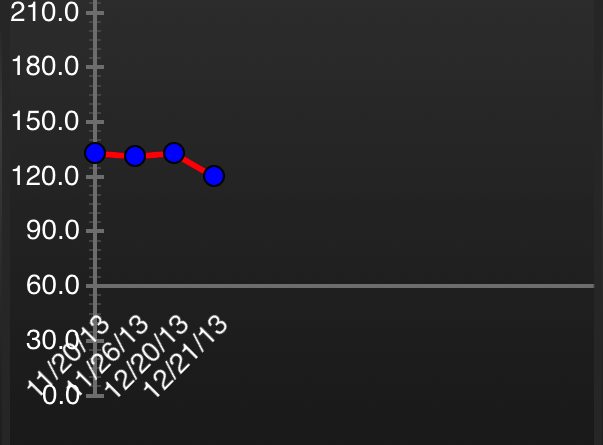
我附上了图表的屏幕截图。
我需要解决以下问题。
1) 该图从 60 开始。因此我不再需要 x 轴下方的 0-60 y 轴线。如何删除那部分? Y轴应该从60开始往上走。
2) 如何为 x 轴添加刻度。由于我的标签是倾斜的,所以我需要正确添加它。
这是我的代码
    // Create graph from theme
graph = [[CPTXYGraph alloc] initWithFrame:CGRectZero];
CPTTheme *theme = [CPTTheme themeNamed:kCPTDarkGradientTheme];
[graph applyTheme:theme];
CPTGraphHostingView *hostingView = (CPTGraphHostingView *)self.view;
hostingView.collapsesLayers = NO; // Setting to YES reduces GPU memory usage, but can slow drawing/scrolling
hostingView.hostedGraph     = graph;

graph.paddingLeft   = 10.0;
graph.paddingTop    = 10.0;
graph.paddingRight  = 10.0;
graph.paddingBottom = 10.0;

// Setup plot space
CPTXYPlotSpace *plotSpace = (CPTXYPlotSpace *)graph.defaultPlotSpace;
plotSpace.allowsUserInteraction = YES;
plotSpace.yRange                = [CPTPlotRange plotRangeWithLocation:CPTDecimalFromFloat(-100.0) length:CPTDecimalFromFloat(500.0)];
plotSpace.xRange                = [CPTPlotRange plotRangeWithLocation:CPTDecimalFromFloat(-2.25) length:CPTDecimalFromFloat(15.0)];

CPTMutableLineStyle *xLineStyle = [CPTMutableLineStyle lineStyle];
xLineStyle.miterLimit       = 1.0f;
xLineStyle.lineWidth            = 3.0f;
xLineStyle.lineColor = [CPTColor whiteColor];
// Axes
CPTXYAxisSet *axisSet = (CPTXYAxisSet *)graph.axisSet;
CPTXYAxis *x          = axisSet.xAxis;
x.visibleRange = [CPTPlotRange plotRangeWithLocation:CPTDecimalFromFloat(0) length:CPTDecimalFromFloat(100)];
x.majorIntervalLength         = CPTDecimalFromString(@"1");
x.orthogonalCoordinateDecimal = CPTDecimalFromDouble(60.0);
x.titleLocation               = CPTDecimalFromFloat(0.5f);
x.titleOffset                 = 5.0f;

x.labelingPolicy = CPTAxisLabelingPolicyNone;
NSMutableArray *customTickLocations = [[NSMutableArray alloc] init];

if (selectedIndex == 0) {
    self.xAxisLabels = [[[NSMutableArray alloc] init] autorelease];
    for (int i = 0; i < [items count]; i++) {
        WeightDTO *weightDTO = [items objectAtIndex:i];

        [xAxisLabels addObject:weightDTO.dateAdded];
        [customTickLocations addObject:[NSString stringWithFormat:@"%d", i]];
    }
}

NSUInteger labelLocation     = 0;
NSMutableArray *customLabels = [NSMutableArray arrayWithCapacity:[xAxisLabels count]];
for ( NSNumber *tickLocation in customTickLocations ) {
    CPTAxisLabel *newLabel = [[CPTAxisLabel alloc] initWithText:[xAxisLabels objectAtIndex:labelLocation++] textStyle:x.labelTextStyle];
    newLabel.tickLocation = [tickLocation decimalValue];
    newLabel.offset       = x.labelOffset + x.majorTickLength;
    newLabel.rotation     = M_PI / 4;
    [customLabels addObject:newLabel];
    [newLabel release];
}

x.axisLabels = [NSSet setWithArray:customLabels];

CPTXYAxis *y = axisSet.yAxis;
y.visibleRange = [CPTPlotRange plotRangeWithLocation:CPTDecimalFromFloat(0) length:CPTDecimalFromFloat(500)];
y.majorIntervalLength         = CPTDecimalFromString(@"30");
y.minorTicksPerInterval       = 5;
y.orthogonalCoordinateDecimal = CPTDecimalFromDouble(0.0);

y.delegate             = self;

// Create a blue plot area
CPTScatterPlot *boundLinePlot  = [[[CPTScatterPlot alloc] init] autorelease];
CPTMutableLineStyle *lineStyle = [CPTMutableLineStyle lineStyle];
lineStyle.miterLimit        = 1.0f;
lineStyle.lineWidth         = 3.0f;
lineStyle.lineColor         = [CPTColor redColor];
boundLinePlot.dataLineStyle = lineStyle;
boundLinePlot.identifier    = @"Blue Plot";
boundLinePlot.dataSource    = self;
[graph addPlot:boundLinePlot];

// Do a blue gradient
CPTColor *areaColor1       = [CPTColor colorWithComponentRed:0.3 green:0.3 blue:1.0 alpha:0.8];
CPTGradient *areaGradient1 = [CPTGradient gradientWithBeginningColor:areaColor1 endingColor:[CPTColor clearColor]];
areaGradient1.angle = -90.0f;
boundLinePlot.areaBaseValue = [[NSDecimalNumber zero] decimalValue];

// Add plot symbols
CPTMutableLineStyle *symbolLineStyle = [CPTMutableLineStyle lineStyle];
symbolLineStyle.lineColor = [CPTColor blackColor];
CPTPlotSymbol *plotSymbol = [CPTPlotSymbol ellipsePlotSymbol];
plotSymbol.fill          = [CPTFill fillWithColor:[CPTColor blueColor]];
plotSymbol.lineStyle     = symbolLineStyle;
plotSymbol.size          = CGSizeMake(10.0, 10.0);
boundLinePlot.plotSymbol = plotSymbol;
最佳答案
我假设您正在使用诸如 configureHost、configurePlot、configureGraph、configureAxes 等方法...
第一个问题: 在您的 configureGraph 中,您可以执行以下操作:
// Set up plot space
CGFloat xMin = 0.0f;
CGFloat xMax = [dates count];
CGFloat yMin;
CGFloat yMax;

if (minAverage > 50) {
    yMin = minAverage-50;
    yMax = maxAverage+20;
} else {
    yMin = 0;
    yMax = maxAverage+20;
}
CPTXYPlotSpace *plotSpace = (CPTXYPlotSpace *) graph.defaultPlotSpace;
plotSpace.xRange = [CPTPlotRange plotRangeWithLocation:CPTDecimalFromFloat(xMin) length:CPTDecimalFromFloat(xMax)];
plotSpace.yRange = [CPTPlotRange plotRangeWithLocation:CPTDecimalFromFloat(yMin) length:CPTDecimalFromFloat(yMax-yMin)];
我已经计算了之前的最小值和最大值(minAverage,maxAverage)并在每一端添加了一些空间。 x 轴配置了 [日期计数],在我的例子中是 30。
你的第二个问题: 在你的方法中 configureAxes 做(标签和刻度计算从 CGFloat dateCount 开始......)
// 3 - Configure the x-axis
CPTXYAxisSet *axisSet = (CPTXYAxisSet *) self.hostView.hostedGraph.axisSet;
axisSet.xAxis.labelingPolicy = CPTAxisLabelingPolicyNone;
axisSet.xAxis.title = @"Day of the month";
axisSet.xAxis.titleTextStyle = axisTitleStyle;
axisSet.xAxis.titleOffset = 15.0f;

if (minAverage > 50) {
    axisSet.xAxis.orthogonalCoordinateDecimal = CPTDecimalFromUnsignedInt(minAverage-50);
}

axisSet.xAxis.axisLineStyle = axisLineStyle;

axisSet.xAxis.labelingPolicy = CPTAxisLabelingPolicyNone;
axisSet.xAxis.labelTextStyle = axisTextStyle;
axisSet.xAxis.majorTickLineStyle = axisLineStyle;
axisSet.xAxis.majorTickLength = 2.0f;
axisSet.xAxis.minorTickLength = 0;
axisSet.xAxis.tickDirection = CPTSignNone;// CPTSignPositive;// CPTSignNegative;

CGFloat dateCount = [sortedWaterlevels count];
NSMutableSet *xLabels = [NSMutableSet setWithCapacity:dateCount];
NSMutableSet *xLocations = [NSMutableSet setWithCapacity:dateCount];
NSInteger i = 0;
for (NSString *date in dates) {
    CPTAxisLabel *label = [[CPTAxisLabel alloc] initWithText:date  textStyle:axisSet.xAxis.labelTextStyle];
    CGFloat location = i++;
    location = location-0.5;
    label.tickLocation = CPTDecimalFromCGFloat(location); //verschieben label
    label.offset = axisSet.xAxis.majorTickLength;
    if (i == 2 || i == 8 || i == 15 || i == 22 || i == 29) {
        if (label) {
            [xLabels addObject:label];
            [xLocations addObject:[NSNumber numberWithFloat:location]];
        }
    } else {
        if (label) {
            [xLocations addObject:[NSNumber numberWithFloat:location]];
        }
    }
}
axisSet.xAxis.axisLabels = xLabels;
axisSet.xAxis.majorTickLocations = xLocations;
显示最近 30 天的刻度,而日期仅从第二天开始每 7 天打印一次。
关于ios - Core-Plot 正确格式化图形,我们在Stack Overflow上找到一个类似的问题: https://stackoverflow.com/questions/20710377/