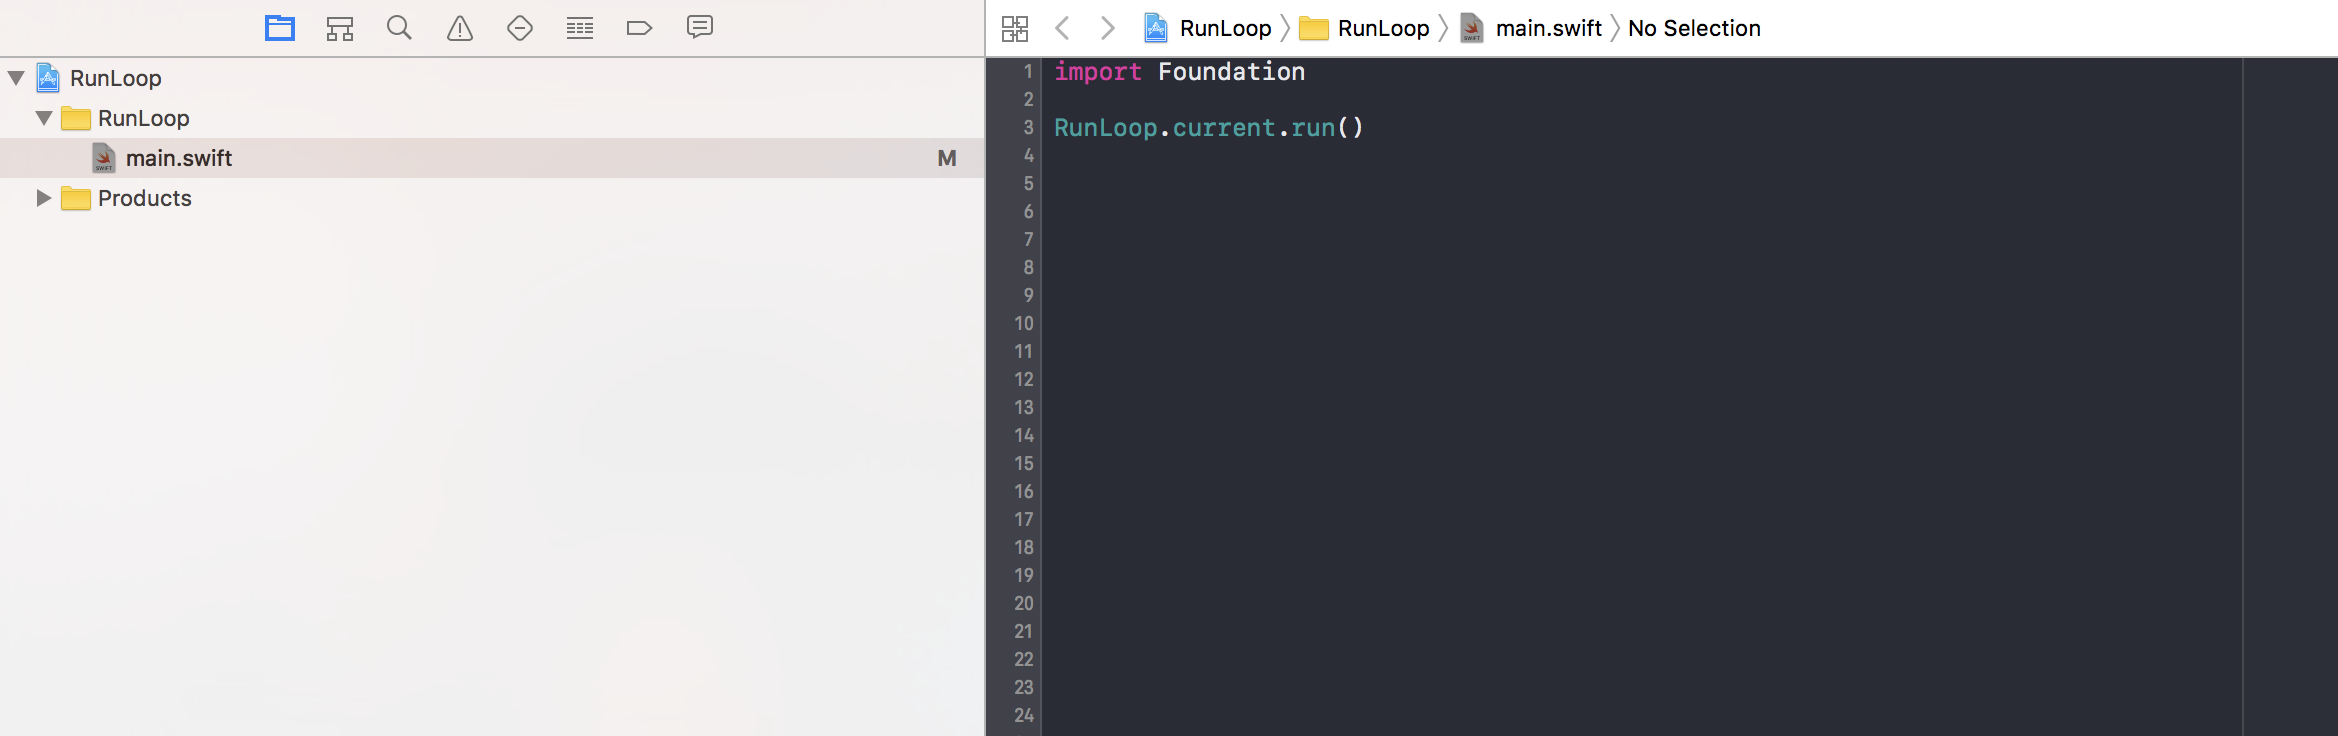
我用 RunLoop 做实验。我正在创建简单的 Mac OS 控制台应用程序并仅调用一行代码。
RunLoop.current.run()
之后在调试导航器中出现第二个线程。为什么?

最佳答案
Grand Central Dispatch (GCD) 提供了一个“主队列”(可在 Swift 中使用 DispatchQueue.main 访问)。主队列总是在主线程上运行它的 block 。
由于 Apple 平台上的应用程序通常运行 RunLoop.main在主线程上,运行循环与 GCD 一起运行添加到主队列的 block 。
因此,当创建主线程的运行循环时,它会创建一些 GCD 对象,这会使 GCD 自行初始化。 GCD 初始化的一部分涉及创建一个“工作队列”和一个线程池,用于运行添加到工作队列的作业。
您可以看到,创建线程的是运行循环的创建,而不是它的运行。这是一个示例程序:
#import <Foundation/Foundation.h>

int main(int argc, const char * argv[]) {
    [NSRunLoop currentRunLoop]; // line 4
    return 0;                   // line 5
}
在终端中,我运行 lldb(调试器)。我告诉它调试 test程序,在第4行设置断点,运行。当它在断点处停止时(在调用 currentRunLoop 之前),我列出了所有线程:
:; lldb
"crashlog" and "save_crashlog" command installed, use the "--help" option for detailed help
(lldb) target create test
Current executable set to 'test' (x86_64).
(lldb) b 4
Breakpoint 1: where = test`main + 22 at main.m:4, address = 0x0000000100000f46
(lldb) r
Process 12087 launched: '/Users/mayoff/Library/Developer/Xcode/DerivedData/test-aegotyskrtnbeabaungzpkkbjvdz/Build/Products/Debug/test' (x86_64)
Process 12087 stopped
* thread #1, queue = 'com.apple.main-thread', stop reason = breakpoint 1.1
    frame #0: sp=0x00007fff5fbff240 fp=0x00007fff5fbff260 pc=0x0000000100000f46 test`main(argc=1, argv=0x00007fff5fbff280) + 22 at main.m:4
   1        #import <Foundation/Foundation.h>
   2
   3        int main(int argc, const char * argv[]) {
-> 4            [NSRunLoop currentRunLoop]; // line 4
   5            return 0; // line 5
   6        }
Target 0: (test) stopped.
(lldb) thread list
Process 12087 stopped
* thread #1: tid = 0x1066d3, 0x0000000100000f46 test`main(argc=1, argv=0x00007fff5fbff280) at main.m:4, queue = 'com.apple.main-thread', stop reason = breakpoint 1.1
只有一个线程。接下来,我跳过对 currentRunLoop 的调用并再次列出所有线程:
(lldb) n
Process 12087 stopped
* thread #1, queue = 'com.apple.main-thread', stop reason = step over
    frame #0: sp=0x00007fff5fbff240 fp=0x00007fff5fbff260 pc=0x0000000100000f69 test`main(argc=1, argv=0x00007fff5fbff280) + 57 at main.m:5
   2
   3        int main(int argc, const char * argv[]) {
   4            [NSRunLoop currentRunLoop]; // line 4
-> 5            return 0; // line 5
   6        }
Target 0: (test) stopped.
(lldb) thread list
Process 12087 stopped
* thread #1: tid = 0x1066d3, 0x0000000100000f69 test`main(argc=1, argv=0x00007fff5fbff280) at main.m:5, queue = 'com.apple.main-thread', stop reason = step over
  thread #2: tid = 0x106ab3, 0x00007fffc942c070 libsystem_pthread.dylib`start_wqthread
  thread #3: tid = 0x106ab4, 0x00007fffc934244e libsystem_kernel.dylib`__workq_kernreturn + 10
  thread #4: tid = 0x106ab5, 0x00007fffc8923e85 libobjc.A.dylib`class_createInstance + 142, queue = 'com.apple.root.default-qos.overcommit'
现在有四个线程,有的在初始化中途停止了。
“但是 Rob,”你说,“当我运行 test在 Xcode 中停止对 currentRunLoop 的调用之前 ,它已经有四个线程了!”如下所示:

“确实如此,”我回答道。如果您运行菜单项 Debug > Debug Workflow > Shared Libraries…,并在筛选框中键入 Xcode,您会发现原因:

当您在 Xcode 下运行该程序时,Xcode 会向您的进程中注入(inject)一些额外的共享库以提供额外的调试支持。这些共享库包括在您的代码运行之前运行的初始化代码,并且该初始化代码对 GCD 执行某些操作,因此 GCD 在您的第一行代码运行之前被初始化(创建其线程池)。
工作队列根据工作量调整其线程池的大小。由于没有向队列中添加作业,它立即将其池缩小到只有一个后台线程。这就是为什么当您查看 Xcode 的 CPU 报告时,您只会看到两个线程:运行运行循环的主线程和一个等待作业运行的工作线程。
关于swift - 为什么在 Mac OS 控制台应用程序中对 runloop.run 的调用方法会创建额外的线程?,我们在Stack Overflow上找到一个类似的问题: https://stackoverflow.com/questions/44867801/