我正在使用 Highchart 的字符栏,我想知道是否有一种方法可以显示平均线(绘图线)的值,在“yAxis”中或鼠标悬停显示上显示值一个对话框,其中包含绘图线的精确值。
我已经显示了平均线,但无法读取图表上的精确值。
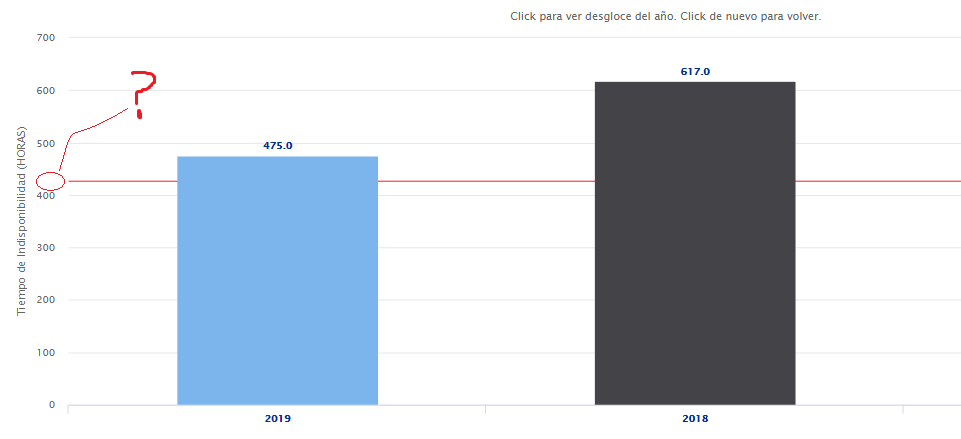
这是 Highchart 中的情节
plotLines: [{
    color: 'red',
    value: avg, // Insert your average here
    width: '1',
    zIndex: 2 // To not get stuck below the regular plot lines
}]
最佳答案
您应该能够显示标签:
plotLines: [{
    color: 'red',
    value: avg, // Insert your average here
    width: '1',
    zIndex: 2, // To not get stuck below the regular plot lines
    label: {
        text: avg,
        textAlign: 'left',
        x: -40
    }
}]
关于javascript - 在 yAxis Highcharts 上显示 PlotLine 值,我们在Stack Overflow上找到一个类似的问题: https://stackoverflow.com/questions/45801305/