我遇到了 jqplot 堆叠条形图图例的问题 , 我想以我自己的自定义方式放置图例。 但是我应用的任何更改都不会生效。
我想要什么 这是
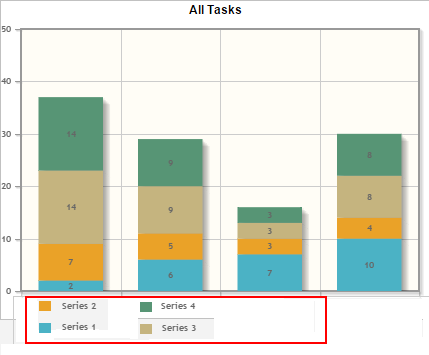
但是我得到的图例如下
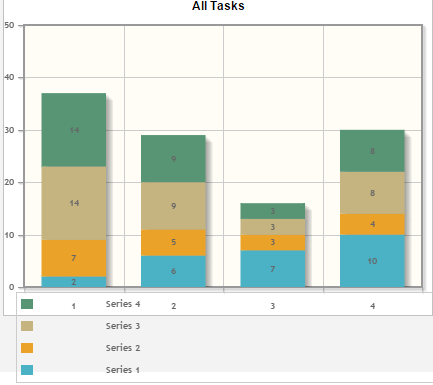
我正在使用的代码片段
var s1 = [2, 6, 7, 10];
  var s2 = [7, 5, 3, 4];
  var s3 = [14, 9, 3, 8];
  var s4 = [14, 9, 3, 8];
  plot3 = $.jqplot('graph_stacked', [s1, s2, s3,s4], {
    // Tell the plot to stack the bars.
    stackSeries: true,
    captureRightClick: true,
    seriesDefaults:{
      renderer:$.jqplot.BarRenderer,
      rendererOptions: {
          // Put a 30 pixel margin between bars.
          barMargin: 35,
          // Highlight bars when mouse button pressed.
          // Disables default highlighting on mouse over.
          highlightMouseDown: true
      },
      pointLabels: {show: true}
    },
    axes: {
      xaxis: {
          renderer: $.jqplot.CategoryAxisRenderer
      },
      yaxis: {
        // Don't pad out the bottom of the data range.  By default,
        // axes scaled as if data extended 10% above and below the
        // actual range to prevent data points right on grid boundaries.
        // Don't want to do that here.
        padMin: 0
      }
    },


    legend:{
            show:true,
            placement:'outside',
            rendererOptions: {
                numberRows: 2,
                numberColumns: 2

            },
            location:'s',
            marginTop: '1px',
            border:'none'

        }
  });
最佳答案
您还没有为图例设置渲染器。
将 renderer 设置为 $.jqplot.EnhancedLegendRenderer
所以图例对象看起来像这样:
legend:{
    renderer: $.jqplot.EnhancedLegendRenderer,
    show:true,
    placement:'outside',
    rendererOptions: {
        numberRows: 2,
        numberColumns: 2
    },
    location:'s',
    marginTop: '40px',
    border:'none'
}
IMP:还要确保,您已将 jqplot.enhancedLegendRenderer.min.js 和 jquery.jqplot.min.css 文件包含在 script 和链接标签。
您可以在此处查看工作 fiddle :Stacked Bar Chart with Legends
希望您在访问上述链接后查看左侧 Pane 中的外部资源部分。您可以在那里查看包含的 JS 和 CSS 文件。
希望对您有所帮助。 :-)
关于javascript - 堆积条形图图例问题 jqplot,我们在Stack Overflow上找到一个类似的问题: https://stackoverflow.com/questions/27598306/