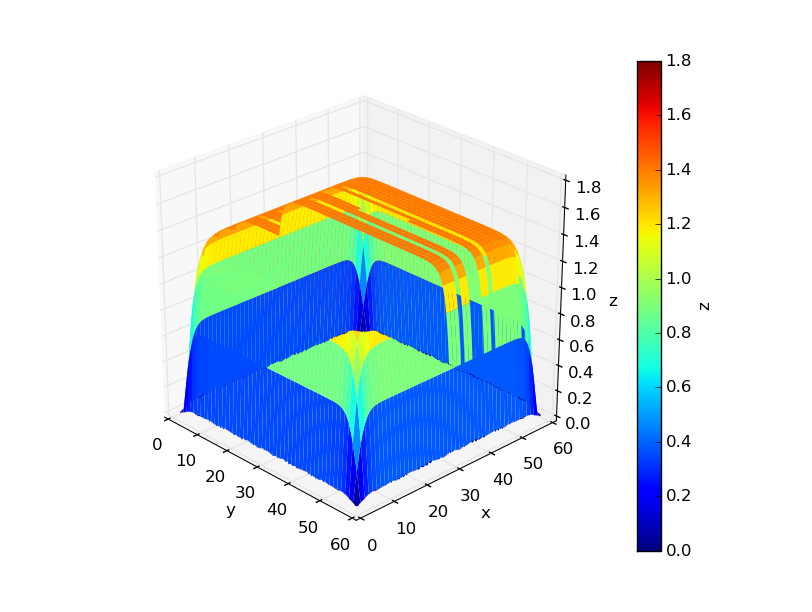
我正在尝试根据一组指定 z 值的数据绘制 3D 表面。尽管我设置了 alpha=1.0,但我得到了一些奇怪的透明人工制品,在那里我可以透过表面看到。
在绘图和保存到文件(png 和 pdf 格式)时都存在人工制品:

我尝试过更改线宽,并将步幅数从 1 更改为 10(在后一种情况下,由于分辨率太粗糙,表面不可见)。
问:我怎样才能摆脱这种透明度?
这是我的代码:
import sys
import numpy as np
import numpy.ma as ma
import matplotlib as mpl
import matplotlib.pyplot as plt
from mpl_toolkits.mplot3d import Axes3D

y_label = r'x'
x_label = r'y'
z_label = r'z'

x_scale = 2.0*np.pi
y_scale = 2.0*np.pi

y_numPoints = 250
x_numPoints = 250

def quasiCrystal(x, y):
    z = 0
    for i in range(0,5):
        z += np.sin(x * np.cos(float(i)*np.pi/5.0) +
                    y * np.sin(float(i)*np.pi/5.0))
    return z

x = np.linspace(-x_scale, x_scale, x_numPoints)
y = np.linspace(-y_scale, y_scale, y_numPoints)
X,Y = np.meshgrid(x,y)

Z = quasiCrystal(X, Y)


f = plt.figure()
ax = f.gca(projection='3d')

surf = ax.plot_surface( X, Y, Z,
                        rstride=5, cstride=5,
                        cmap='seismic',
                        alpha=1,
                        linewidth=0,
                        antialiased=True,
                        vmin=np.min(Z),
                        vmax=np.max(Z)
                      )

ax.set_zlim3d(np.min(Z), np.max(Z))

f.colorbar(surf, label=z_label)

ax.set_xlabel(x_label)
ax.set_ylabel(y_label)
ax.set_zlabel(z_label)

plt.show()
这是我的实际数据的另一张图片,可以更容易地看到人工制品:
最佳答案
Matplotlib 不是“真正的”3D 引擎。这是一个众所周知的问题,偶尔会出现与您类似的问题(请参阅 this 和 this)。问题在于,同一个人工制品可能会引发看似不同的问题。我相信你就是这种情况。
在继续我的建议之前,让我先说 quote this information from the maplotlib website :
My 3D plot doesn’t look right at certain viewing angles
This is probably the most commonly reported issue with mplot3d. The problem is that – from some viewing angles – a 3D object would appear in front of another object, even though it is physically behind it. This can result in plots that do not look “physically correct.”
Unfortunately, while some work is being done to reduce the occurance of this artifact, it is currently an intractable problem, and can not be fully solved until matplotlib supports 3D graphics rendering at its core.
The problem occurs due to the reduction of 3D data down to 2D + z-order scalar. A single value represents the 3rd dimension for all parts of 3D objects in a collection. Therefore, when the bounding boxes of two collections intersect, it becomes possible for this artifact to occur. Furthermore, the intersection of two 3D objects (such as polygons or patches) can not be rendered properly in matplotlib’s 2D rendering engine.
This problem will likely not be solved until OpenGL support is added to all of the backends (patches are greatly welcomed). Until then, if you need complex 3D scenes, we recommend using MayaVi.
It seems that Mayavi has finally moved on to Python 3 ,所以它当然有可能。如果您想坚持使用 matplotlib 来绘制此类图,我的建议是您使用 rstride 和 cstride 值来查看哪些产生了令您满意的图。
surf = ax.plot_surface( X, Y, Z,
                        rstride=5, cstride=5,
                        cmap='jet',
                        alpha=1,
                        linewidth=0,
                        antialiased=True,
                        vmin=0,
                        rstride=10,
                        cstride=10,
                        vmax=z_scale
                      )
其他可能性是尝试查看其他类型的 3D 图是否表现更好。检查plot_trisurf , contour或 contourf .我知道它不理想,但过去我也设法 circumvent other type of artefacts using 3D polygons .
很抱歉没有更满意的答案。也许其他 SO 用户对此有更好的解决方案。祝你好运。
关于python - Matplotlib plot_surface 透明度人工制品,我们在Stack Overflow上找到一个类似的问题: https://stackoverflow.com/questions/39144482/